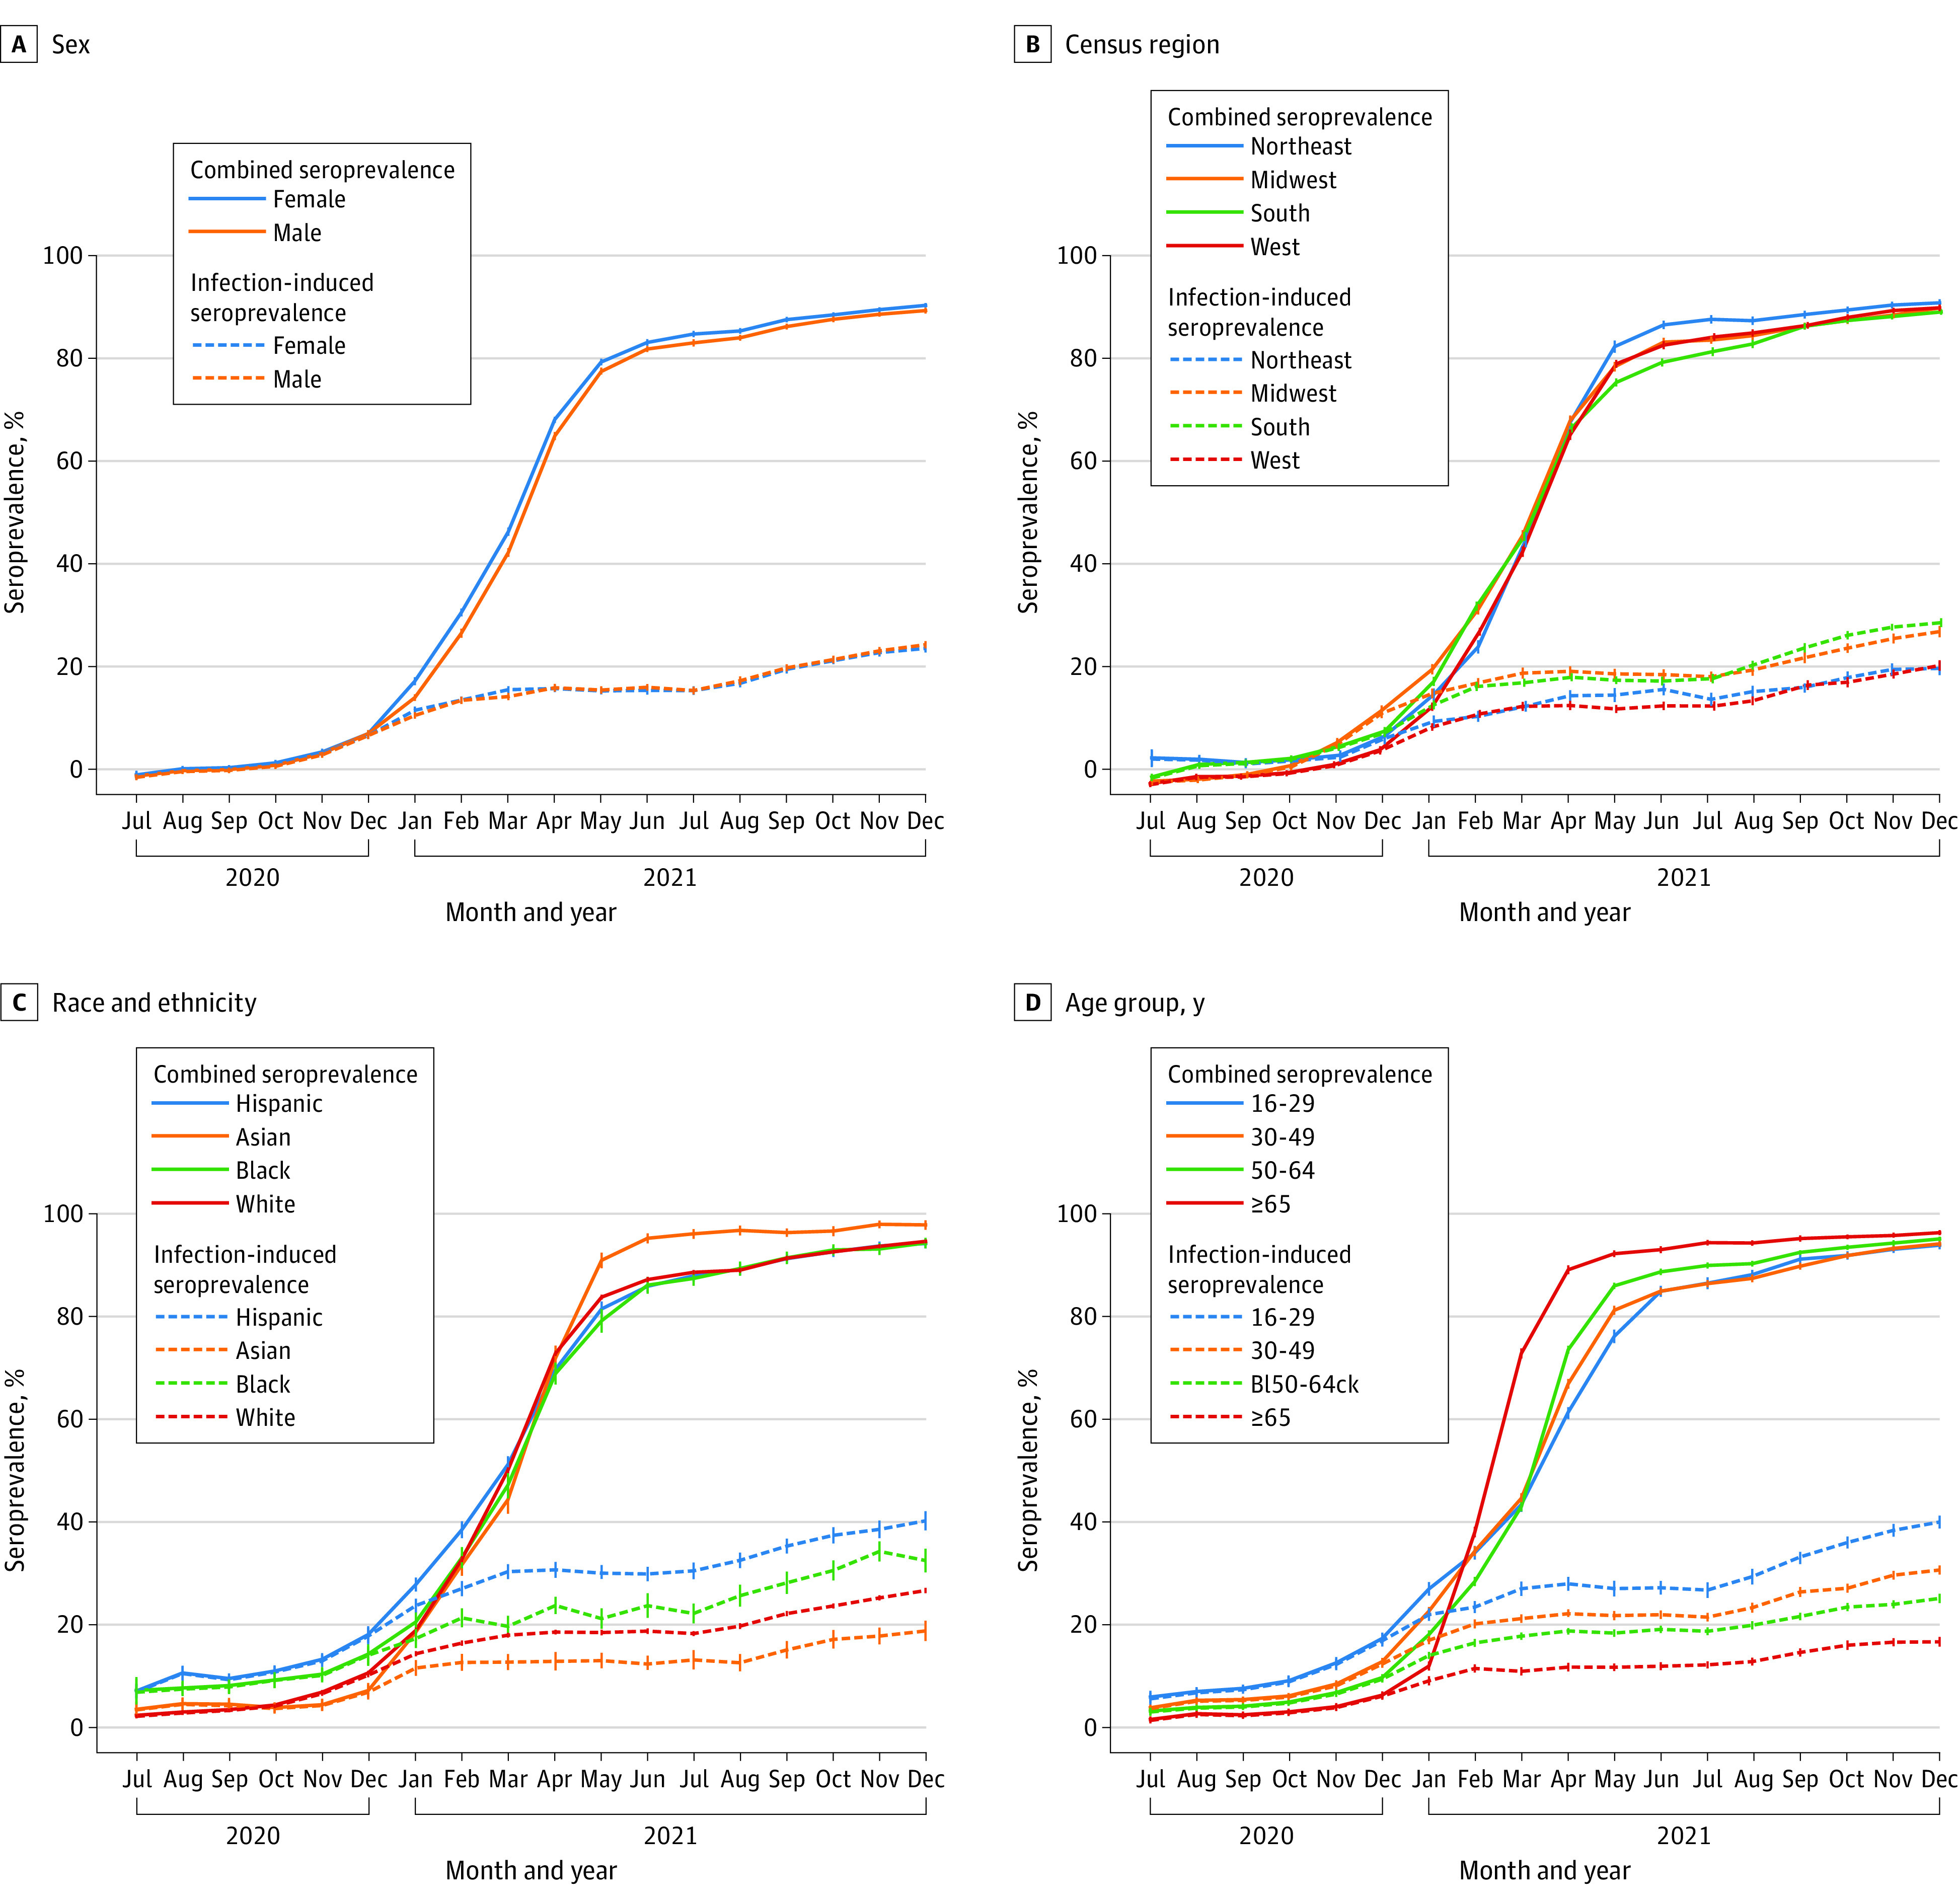
Figure 1. SARS-CoV-2 Seroprevalence by Census Region, Race and Ethnicity, Sex, and Age, US, July 2020-December 2021.

Blood donations were collected from a catchment area representing 69% of the US population in July 2020, increasing to 74% from October 2020 through December 2021. The solid lines represent the proportion of the population with antibodies from infection, vaccination, or both (antispike/combined seroprevalence). The dashed lines represent the proportion of the population with antibodies from infection (antinucleocapsid/infection-induced seroprevalence). Whiskers represent 95% CIs. Seroprevalence was estimated by race and ethnicity because infection and vaccination rates have been demonstrated to differ correspondingly. Blood donors self-identified race and ethnicity from 7 mutually exclusive categories: American Indian, Asian, Black, Hispanic, White, more than 1 race, and other. American Indian, more than 1 race, and other are not shown owing to small numbers. Of 2 475 061 blood donor specimens from donors residing in the study regions, 66 953 (2.7%) were excluded for missing race and ethnicity information and 16 (<0.1%) were excluded for missing data on sex or age. The x-axis tick marks represent the middle of each month.
