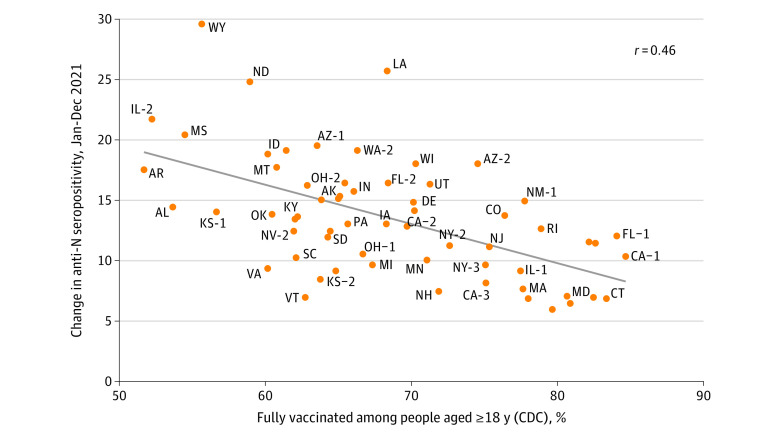
Figure 2. Association Between Study Region December 2021 Vaccination Rate and Increase in Infection-Induced Seroprevalence During 2021.
Fully vaccinated rates were measured with vaccine data as reported to the Centers for Disease Control and Prevention (CDC). Fully vaccinated was defined according to CDC definitions (ie, receipt of ≥2 messenger RNA COVID-19 vaccine doses or ≥1 Ad26.COV2.S dose [Janssen]). The fully vaccinated rate was measured as of December 31, 2021, among adults aged 18 years or older residing in the counties corresponding to each study region. Methods to form the study regions and a map of the study regions have been published.1 Georgia and Hawaiʻi regions were removed because county of residence was missing for most records. The increase in seroprevalence was measured as the change in infection-induced seroprevalence (ie, the N antibody seroprevalence) per increase in vaccine percentage from January 2021 to December 2021 to estimate the number of infections that occurred after COVID-19 vaccination administration had begun. A regression line is displayed in gray (slope = −0.32; P < .001). The correlation coefficient was −0.46. N indicates nucleocapsid.

