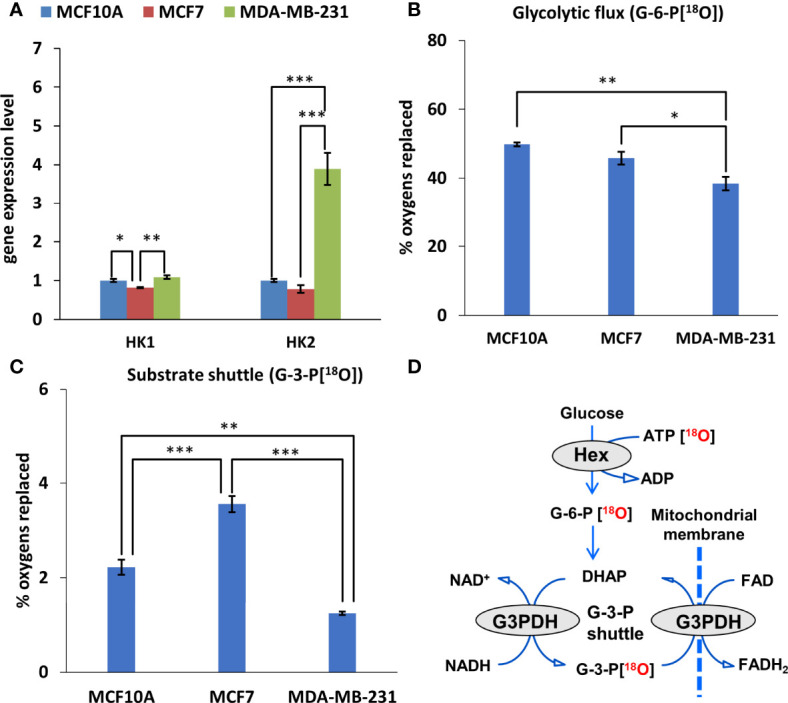
Figure 3.

Glycolytic and mitochondrial substrate shuttle profile of Luminal A, Triple-negative breast cancer cells, and breast control cells. (A) HK (fold change of the mRNA level) isoform expression pattern in Luminal A (MCF7), Triple-negative (MDA-MB-231) breast cancer cells, and breast control cells (MCF10A). 18O-metabolic labeling of (B) G-6-P[18O] and (C) G-3-P[18O] reflecting glycolytic and substrate shuttle activities, respectively. (D) Schematic representation of metabolite 18O-labeling allowing for tracking glycolytic and G-3-P substrate shuttle dynamics. All data are presented as mean ± SEM (ANOVA followed by Holm-Sidak test n=3). *, ** and *** indicate statistically significant difference between the mean values, p < 0.05, p < 0.01, and p < 0.001, respectively. HK – hexokinase; G-6-P – glucose-6-phosphate; G-3-P – glycerol-3-phosphate.
