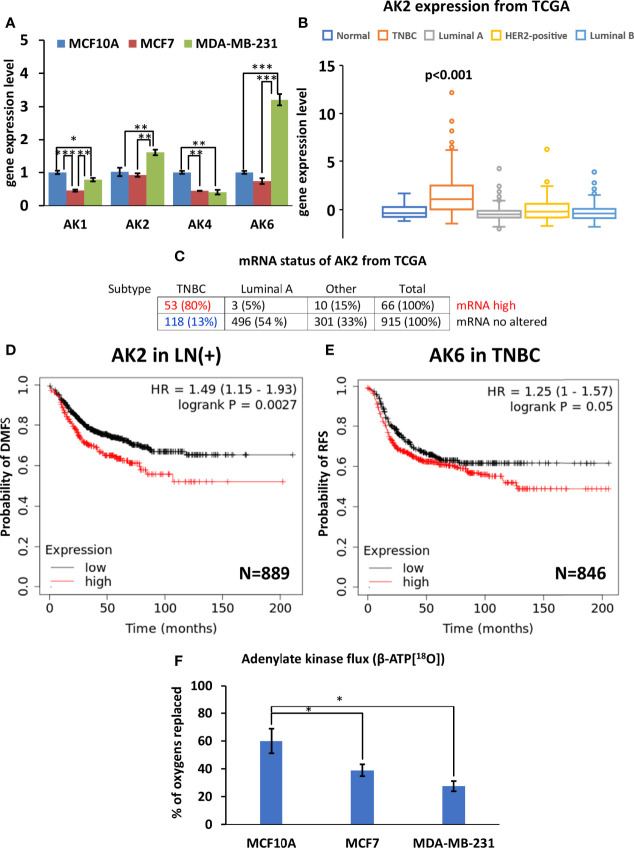
Figure 5.
Characterization of adenylate kinase (AK) network in Luminal A, Triple-negative breast cancer (TNBC) cells, and breast control cells. (A) Expression patterns of AK (fold change of the mRNA level) isoforms in Luminal A (MCF7), Triple-negative (MDA-MB-231) breast cancer, and control cells (MCF10A). The Cancer Genome Atlas (TCGA) database was utilized to analyze (B) AK2 expression patterns (ANOVA followed by Holm-Sidak test) and (C) mRNA status in different breast cancer subtypes. Kaplan-Meier survival analysis showing the relationship between (D) AK2 mRNA expression and distant metastasis-free survival (DMFS) in lymph node-positive (LN(+)) breast cancer patients, and the relationship between (E) AK6 mRNA expression and recurrence-free survival (RFS) in TNBC patients. (F) 18O-metabolic labeling of β-ATP[18O], reflecting AK flux. (D, E) Statistical analysis was performed using the Log-rank test. (A, F) are presented as mean ± SEM (ANOVA followed by Holm-Sidak test n=3-5). *, ** and *** indicate statistically significant differences between the mean values; p < 0.05,p < 0.01, and p < 0.001, respectively.

