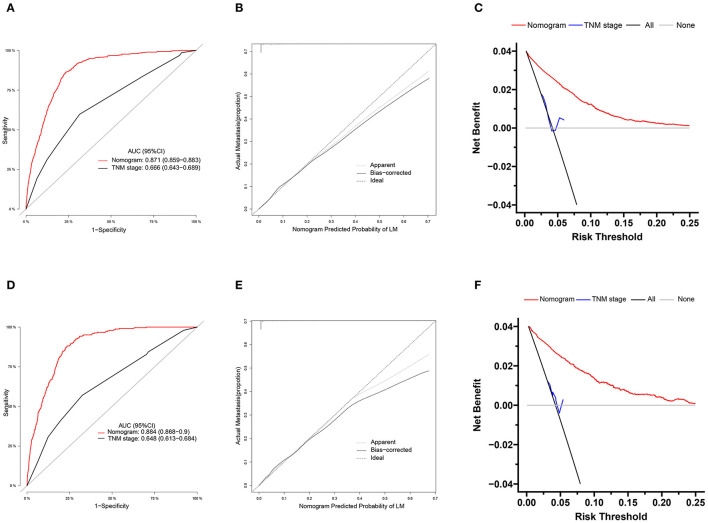
Figure 5.
ROC curves, calibration plots and decision curves of the nomogram for the risk of pancreatic cancer with lung metastasis. (A) The AUC was utilized to judge the advantages and disadvantages of nomogram. (B) Calibration plot for the diagnostic nomogram. The diagonal 45-degree line indicates perfect prediction. (C) Decision curve analysis for the diagnostic nomogram. The net benefit calculated by adding true positive and minus the false positive corresponds to the measurement of Y-axis; X-axis represents the threshold probability. (D–F) The AUC, calibration plot and decision curve in validation cohort.

