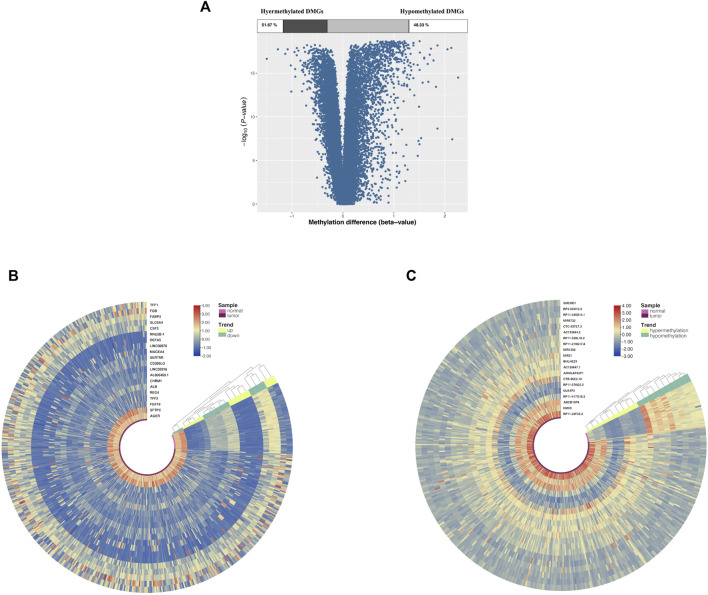
FIGURE 2.
DMG and DEG analysis in cancer and adjacent samples from LUAD patients. (A) Volcano plot of DMGs; the percentages of hypermethylated and hypomethylated DMGs are displayed on top. (B) Heatmap of top 20 DEGs (10 upregulated genes and 10 downregulated genes). (C) Heatmap of top 20 DMGs (10 hypermethylated genes and 10 hypomethylated genes); red indicates that the expression of genes is relatively upregulated, or the level of methylation is hypermethylated, and blue indicated that the expression of genes is relatively downregulated, or the level of methylation is hypomethylated.

