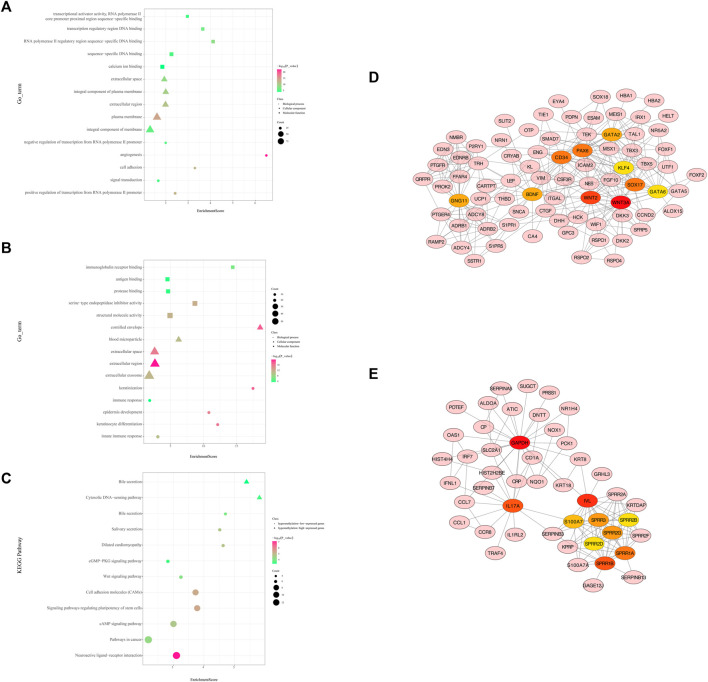
FIGURE 4.
Protein-protein interaction (PPI) network and enrichment bar graph for methylation-related DEGs. (A) Enrichment bubble graph for hypermethylated downregulated genes. (B) Enrichment bubble graph for hypomethylated upregulated genes. (C) KEGG enrichment bubble chart of hypermethylated downregulated genes and hypomethylated upregulated genes. (D) PPI network of hypermethylation and low-expression genes between cancer and adjacent samples from LUAD patients (only displays the 10 hub genes and the expanded subnetwork identified by the cytoHubba app in Cytoscape). (E) PPI network of hypomethylation and high-expression genes between cancer and adjacent samples from LUAD patients (only displays the 10 hub genes and the expanded subnetwork identified by the cytoHubba app in Cytoscape).

