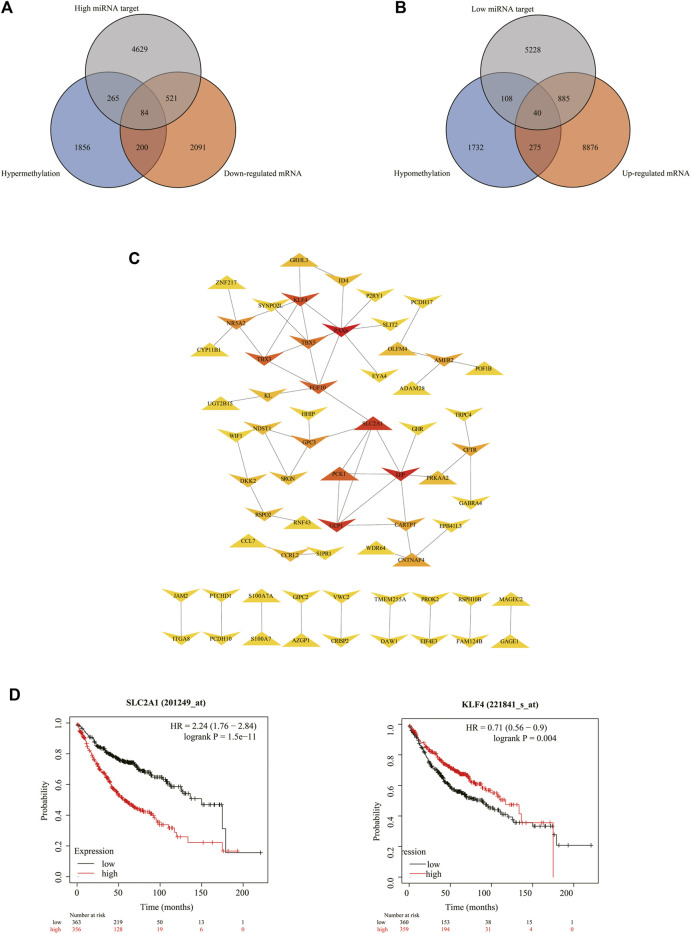
FIGURE 6.
Details for all the overlapped genes. (A,B) Venn graph for all the overlapped genes including 84 downregulated genes and 40 upregulated genes, respectively. (C) PPI network of all the overlapped genes including 84 downregulated genes and 40 upregulated genes. (D) Kaplan–Meier analysis of patients with low (black curve) and high (red curve) expressions of SLC2A1 and KLF4.

