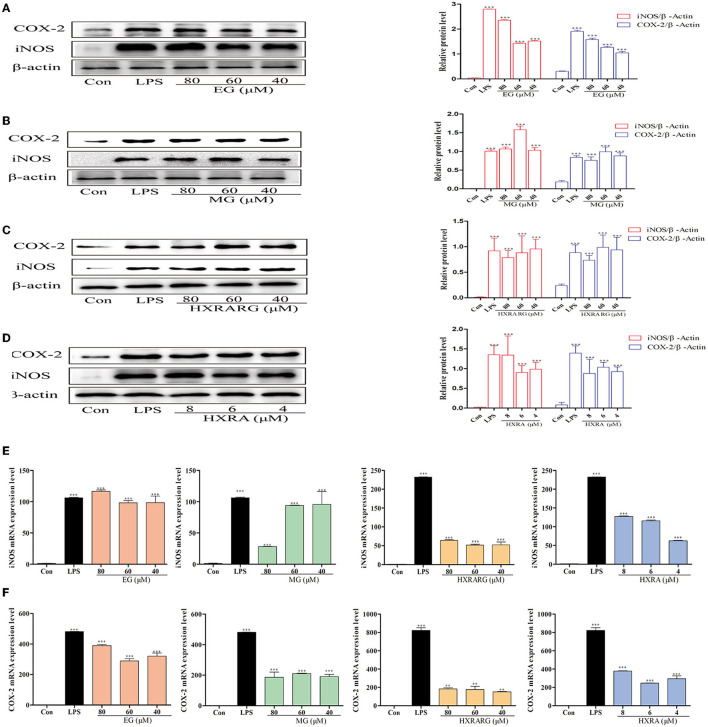
Figure 5.
Effects of different concentrations of EG, MG, HXRARG, and HXRA on iNOS and Cox-2 protein (A–D) and mRNA (E,F) expression in RAW264.7 cells. (A–D): the left side was the protein band diagram, and the right side was the protein quantification diagram. (E) mRNA expression of iNOS. (F) mRNA expression of COX-2. Data are expressed as the means ± SD. Compared with the control, **P < 0.01, ***P < 0.001.

