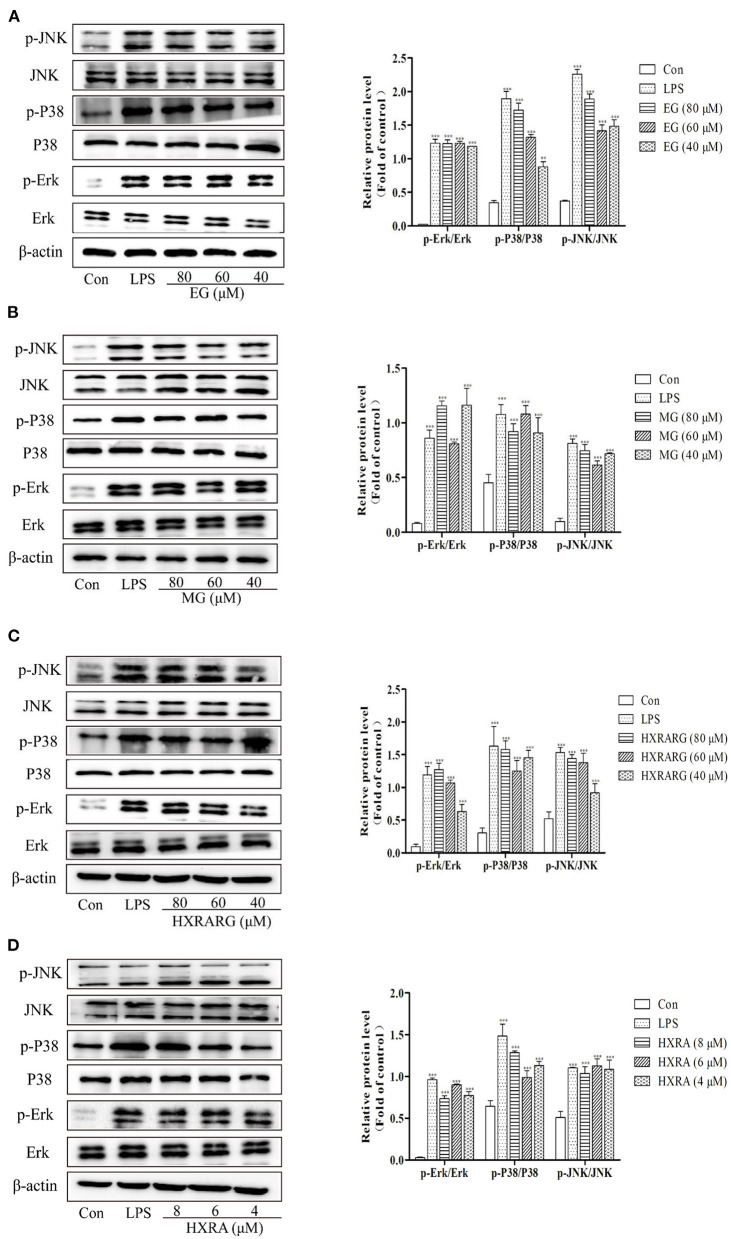
Figure 9.
Effects of different concentrations of EG (A), MG (B), HXRARG (C), and HXRA (D) on the expression of related proteins in MAPK signaling pathway in RAW264.7 cells. The left side was the protein band diagram, and the right side was the protein quantification diagram. Data are expressed as the means ± SD. Compared with the control, ***P < 0.001.

