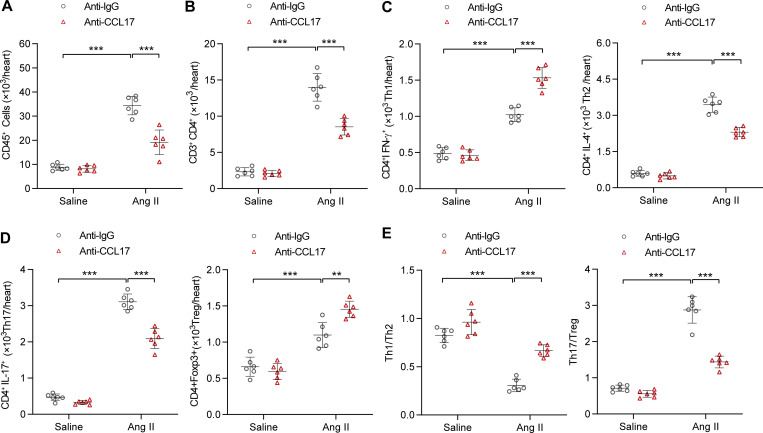
Figure 6.
CCL17 neutralizing antibodies inhibited Ang II–induced inflammatory response. (A–D) Flow cytometry analysis of CD45+ T cells (A), CD3+CD4+ T cells (B), and T cell subsets (C and D) of saline- or Ang II–infused C57BL/6J background WT mice (8–12 wk old) treated with IgG control or anti-CCL17 antibodies (n = 6 biological replicates). (E) Th1/Th2 and Th17/Treg ratios in C57BL/6J background WT mice (8–12 wk old) treated with IgG control or anti-CCL17 antibodies after saline or Ang II infusion (n = 6 biological replicates). All data are presented as the mean ± SD. The Kolmogorov–Smirnov normality test was used to assess data distribution. Statistical significance was tested and obtained using one-way ANOVA, followed by the Bonferroni post hoc test (A–E). **, P < 0.01; ***, P < 0.001.

