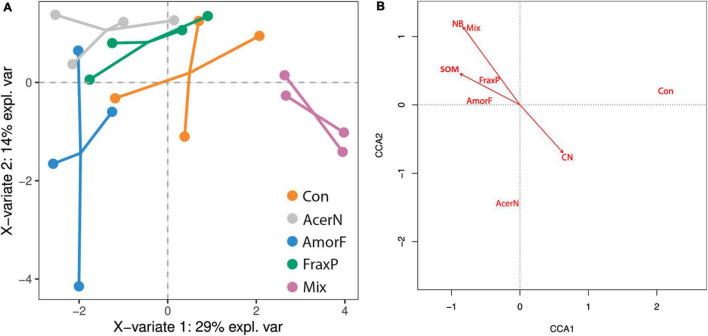
FIGURE 3.
Multivariate relationships among invasive species co-occurrence, soil conditions, and plant communities. (A) Biplot with two main axes of variation (43% explained variance) in whole soil conditions (dots linking communities belong to the same treatment) in response to invasive treatments (orange: control; pink: A. negundo; blue: A. fruticosa; green: F. pennsylvanica; gray: Mix). (B) Biplot showing the effects of soil conditions (arrows) on plant species distribution (omitted for clarity) across invasive treatments (black text). The first two axes explain 30% of variance.

