FIGURE 3.

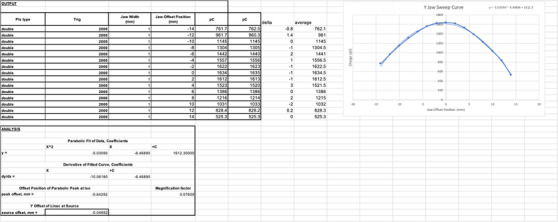
Y‐jaw versus output sweep curve (the solid line) and the corresponding parabolic fit curve (the dashed line). The actual source misalignment is 0.049 mm

Y‐jaw versus output sweep curve (the solid line) and the corresponding parabolic fit curve (the dashed line). The actual source misalignment is 0.049 mm