FIGURE 4.

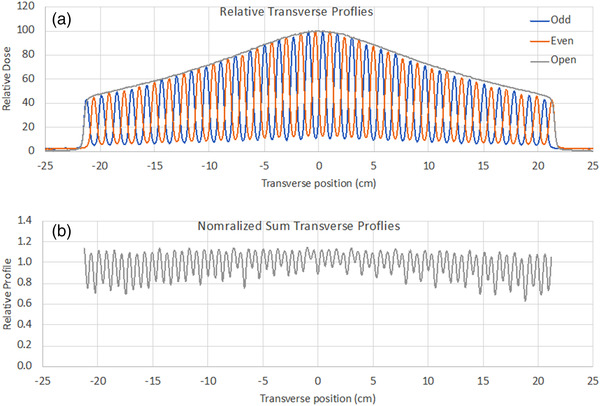
MLC T&G and open field profiles (upper). Normalized sum profile for even and odd profiles (lower). The out‐of‐focus value calculated from the image was 0.66%

MLC T&G and open field profiles (upper). Normalized sum profile for even and odd profiles (lower). The out‐of‐focus value calculated from the image was 0.66%