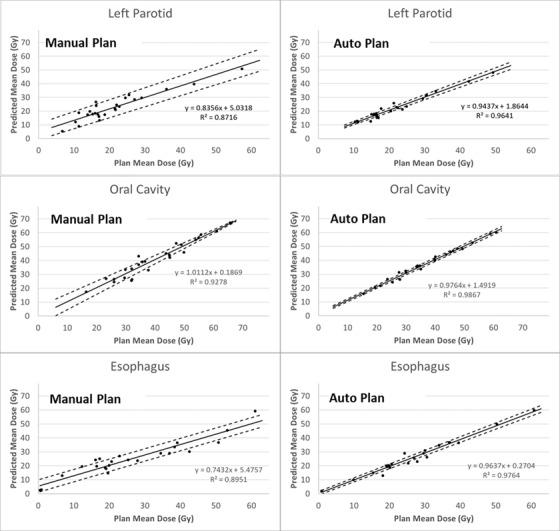
FIGURE 1.

Linear regression between achieved and predicted mean doses to the left parotid, oral cavity, and esophagus for the 25 patients in evaluation cohort 1. Solid lines are fitted by the achieved mean dose of manual or automated plans and the predicted mean dose (derived from the average of upper and lower predicted dose–volume histograms (DVHs) by RapidPlan) of the manual planning (MP) or automated planning (AP) models. Dashed lines indicate regressions using the upper and lower predictions
