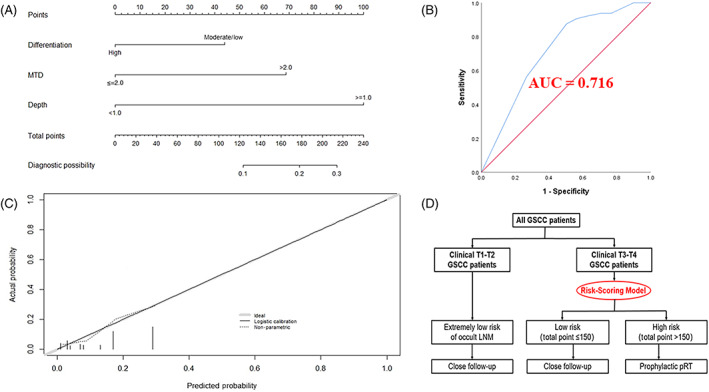
FIGURE 2.

Construction, assessment, and validation of the predictive model. (A) The nomogram for predicting occult LNM risk in GSCC patients with T3‐T4 stages. (B) The ROC curve and AUC of the nomogram; ROC receiver operating characteristics. (C) The calibration curve of the nomogram for predicting occult LNM risk. Actual probability is plotted on the y‐axis, and nomogram predicted probability on the x‐axis. (D) Risk stratification and postoperative adjuvant radiotherapy strategy for GSCC patients
