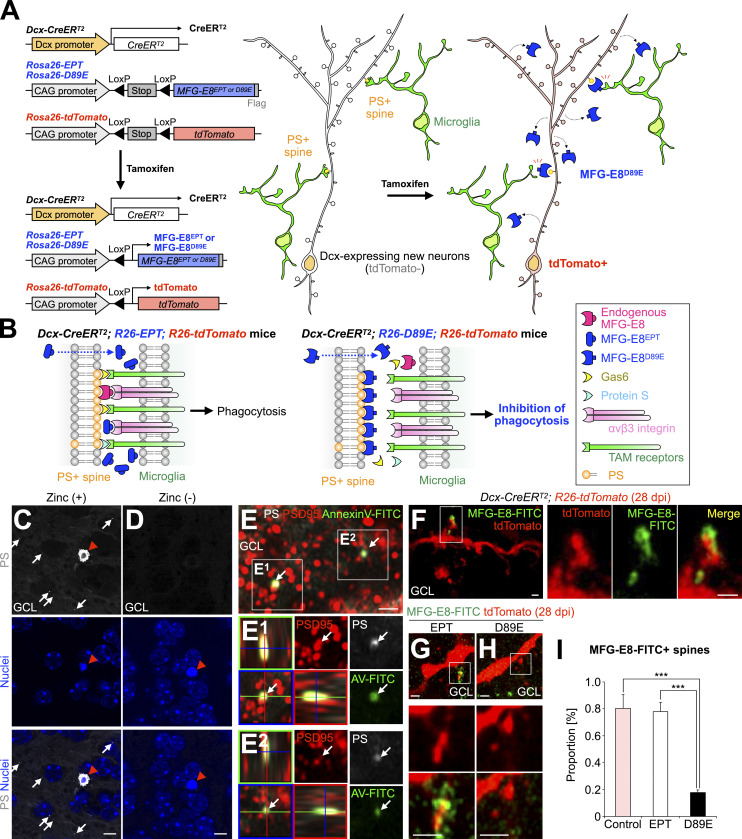
Figure 2.
MFG-E8D89E masks PS exposed at spines in vivo. (A) Schematic illustration of the transgenic mouse lines developed in the study. Left: Following Cre-mediated excision of the LoxP-flanked “Stop” sequence, MFG-E8EPT and MFG-E8D89E (see explanation in B) are expressed under the control of the CAG promoter located in the Rosa26 locus. Dcx-CreERT2 mice were used for Tamoxifen-induced recombination in Dcx-expressing new neurons in the adult brain. Rosa26-tdTomato mice were used to visualize recombined Dcx-expressing cells. Right: Tamoxifen-induced expression of MFG-E8D89E in Dcx-expressing cells in the adult brain. MFG-E8D89E (blue) is specifically secreted from Dcx-expressing new neurons and masks PS+ spines (yellow) to suppress microglial phagocytosis. Recombined new neurons are visualized by tdTomato expression (red). (B) Mechanism for the inhibition of PS-dependent phagocytosis by MFG-E8D89E. Under physiological conditions, PS on damaged or apoptotic cells/synapses is recognized by adaptor molecules from several phagocytic pathways, including the MFG-E8-αvβ3 integrin pathway (magenta and pink, respectively) and the Protein S/Gas6/TAM receptors pathway (light blue, yellow, and green, respectively). Overexpressed MFG-E8EPT (left, blue), which binds to αvβ3 integrin but not PS, does not interfere with phagocytosis. On the contrary, overexpressed MFG-E8D89E (right, blue), which is a dominant-negative form of MFG-E8, binds to PS but not αvβ3 integrin, hindering PS recognition and subsequent phagocytosis. (C and D) Representative images of the GCL in the OB of adult WT mice injected with PSVue550 (white) with (C) or without (D) zinc solution (n = 3 mice). White arrows and red arrowheads indicate PS+ dots and a pyknotic cell, respectively. Nuclei are stained by Hoechst 33342 (blue). (E) Representative images of the GCL in the OB of adult WT mice injected with PSVue550 (white) and AnnexinV-FITC (green), stained for postsynaptic marker PSD95 (red; n = 3 mice, pooled from two independent experiments). The boxed area is enlarged in the bottom. Arrows in the boxed area (E1 and E2, orthogonal view) indicate PS+AnnexinV-FITC+PSD95+ signal. (F–H) Representative images of the GCL in the OB of control (F, n = 3 mice), EPT (G, n = 3 mice), and D89E (H, n = 4 mice) mice injected with MFG-E8-FITC (green). The boxed areas (F–H) are enlarged in the right (F) and bottom (G and H). (I) Proportion of MFG-E8-FITC+tdTomato+ spines in control (n = 3 mice), EPT (n = 3 mice), and D89E (n = 4 mice) mice (pooled from three independent experiments; F(2,7) = 33.2, P = 0.00027, one-way ANOVA; control versus D89E, P = 0.00053, EPT versus D89E, P = 0.00067, Tukey–Kramer test). GCL, granule cell layer. Scale bars in C and D, 5 µm; E–H, 1 µm. ***, P < 0.005. Data shown are mean ± SEM.

