Figure 1.
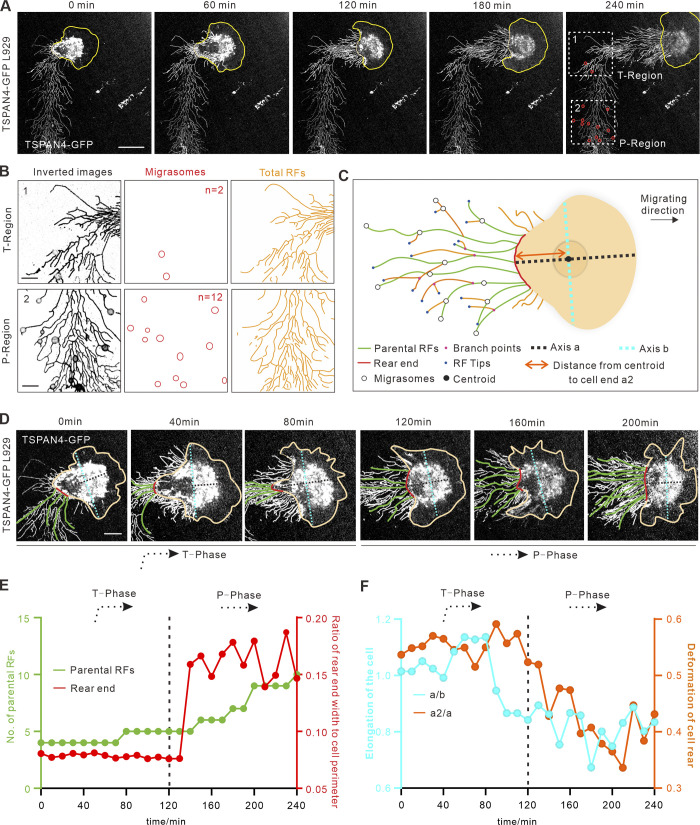
Migrasomes form less when a migrating cell turns. (A) Representative images from a time-lapse video of a L929 cell expressing TSPAN4-GFP. Yellow lines mark the outline of the cell, and white boxes indicate ROIs of T-region and P-region. Scale bar, 20 µm. (B) Analysis of TSPAN4-GFP signals in T-phase and P-phase depicted in A. Images were inverted, and migrasomes and RFs were masked on the right panel. n in middle panel represents the number of migrasomes. Scale bars, 10 µm. (C) Schematic diagram of a migrating cell. Different migration-associated components and indexes are defined in the diagram. (D) Enlarged time-lapse image of the cell shown in A, with rear end and parental RFs indicated as red and green lines, respectively. Axis a and axis b are indicated with cyan and black dashed lines, respectively. Scale bars, 10 µm. (E) Quantification of parental RFs (green lines) and the ratio of rear end width to cell perimeter (red lines) of the migrating cell in A. (F) Quantification of the length ratio of a to b (cyan) and a2 to a (orange) in each time point of the migrating cell in A. Black dashed line in E and F indicates the time cutoff point between T-phase and P-phase. n = 25 time points.

