Figure 2.
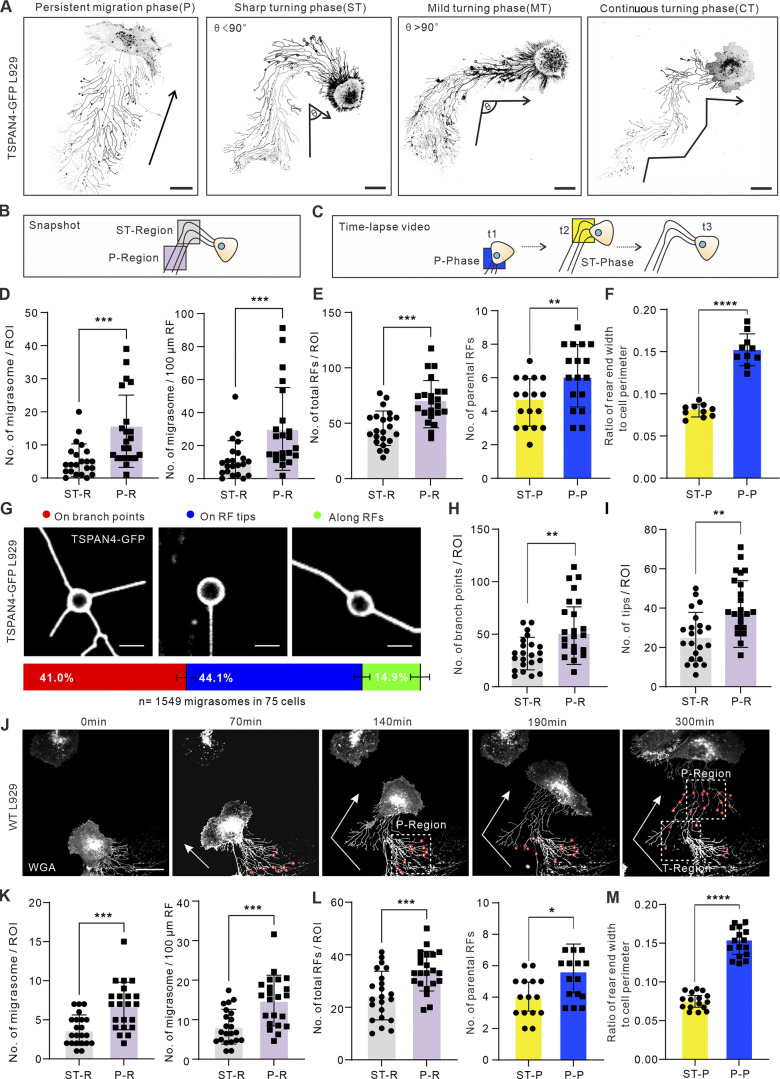
Cell turning leads to narrower rear ends and consequently fewer RFs. (A) Examples of different migration patterns of TSPAN4-GFP L929 cells. Black arrows indicate the migration direction. Ө indicates the turning angle. Scale bars, 20 µm. (B) Schematic diagram of the analyzed region for quantifying the number of migrasomes (per ROI and per 100 μm) and total RFs. ST-region, sharp turning region. (C) Schematic diagram of the time point for calculating the number of parental RFs and rear ends. t1, t2, and t3 are ordinal chronological points of the cell. (D) Quantification of the number of migrasomes per ROI (T-region or P-region) or per 100 μm of RFs within the ROI in ST cells. n = 22 cells. (E) Quantification of total RFs (n = 22) and parental RFs (n = 17) within the ROI in T-phase and P-phase of the ST cell. (F) Quantification of the ratio of rear end width to cell perimeter within the ROIs in T-phase and P-phase of the ST cells. n = 10 cells. (G) Three types of migrasome localizations in RF networks and their corresponding proportions in TSPAN4-GFP L929 cells. Scale bars, 5 µm. Quantification is from n = 1,549 migrasomes in 75 cells. (H) Quantification of the branch points within the defined ROIs in T-phase and P-phase of the ST cells. n = 22 cells. (I) Quantification of the tips within the defined ROIs in T-phase and P-phase of the ST cells. n = 22 cells. (J) Representative images from a time-lapse video of WT L929 cell. White arrows indicate the migration direction; red circles indicate migrasomes, and white boxes indicate ROIs of T-region and P-region. Scale bar, 20 µm. (K) Quantification of the number of migrasomes per ROI (T-region or P-region), or per 100 μm of RFs within the ROI in ST cells. n = 22 cells. (L) Quantification of the number of total RFs and parental RFs within the ROI in T-phase and P-phase of the ST cell. n = 22 cells in left panel and n = 15 cells in right panel. (M) Quantification of the ratio of rear end width to cell perimeter within the ROIs in T-phase and P-phase of the ST cells. n = 16 cells. The data for quantification in D–F, H, I, and K–M are from n = 3 independent experiments. The data are presented as mean ± SD (t test). *, P < 0.05; **, P < 0.01; ***, P < 0.001; ****, P < 0.0001.

