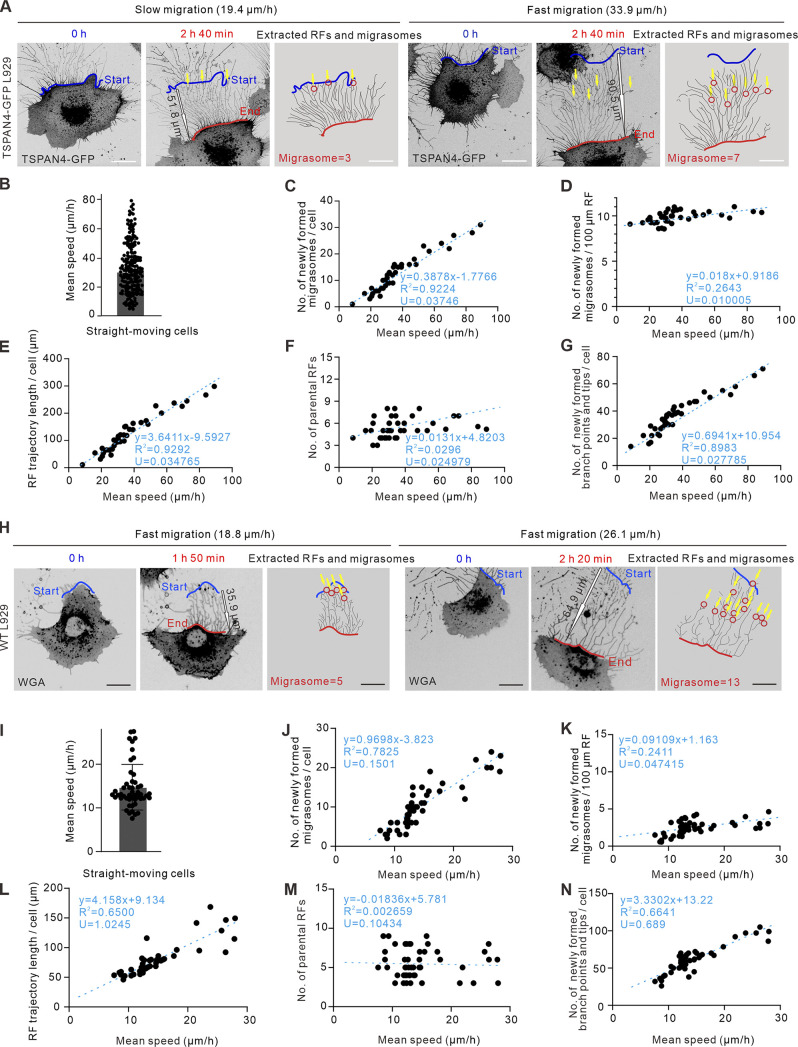
Figure 3.
Migrasomes form more when cells migrating faster regardless of their migration persistence. (A) Representative images from time-lapse videos of an L929 cell expressing TSPAN4-GFP. The left panel shows an example of a slow persistent migrating cell, and the right panel shows an example of a fast persistent migrating cell; red and blue lines indicate the start and end positions of the migrating cell, respectively; yellow arrows indicate the position of migrasome formation; and black outline arrows indicated the displacement of the migrating cell. Scale bar, 20 µm. (B) Quantification of average speed of straight-moving cells in the same culture condition. n = 200 cells. (C) Quantification of the number of newly formed migrasomes per cell in straight-moving cells. n = 39 cells. (D) Quantification of the number of newly formed migrasomes per 100-µm RF trajectory in straight-moving cells. n = 39 cells. (E) Quantification of the RF trajectory length per cell in straight-moving cells. n = 39 cells. (F) Quantification of the number of parental RFs per cell in straight-moving cells. n = 39 cells. (G) Quantification of the number of newly formed branch points and tips per cell in straight-moving cells. n = 39 cells. The fitting lines are indicated by the blue dashed line, and the fitting equations are listed in each panel from C to G, with goodness of fit R2 and uncertainty of the fitting slope U to define the correlation coefficient. (H) Representative images from time-lapse videos of WT L929 cells. The left panel shows an example of a slow persistent migrating cell, and the right panel shows an example of a fast persistent migrating cell; red and blue lines indicated the start and end position of the migrating cell, respectively; red circles indicate migrasomes; yellow arrows indicate the position of migrasome formation; and black outline arrows indicated the displacement of the migrating cell. Scale bar, 20 µm. (I) Quantification of average speed of straight-moving WT L929 cells in the same culture condition. n = 41 cells. (J) Quantification of the number of newly formed migrasomes per cell in straight-moving cells. n = 43 cells. (K) Quantification of the number of newly formed migrasomes per 100-µm RF trajectory in straight-moving cells. n = 44 cells. (L) Quantification of the RF trajectory length per cell in straight-moving cells. n = 39 cells. (M) Quantification of the number of parental RFs per cell in straight-moving cells. n = 41 cells. (N) Quantification of the number of newly formed branch points and tips per cell in straight-moving cells. n = 41 cells. The fitting lines are indicated by blue dashed line, and the fitting equations are listed in each panel from C–G and J–N with goodness of fit R2 and uncertainty of the fitting slope U to define the correlation coefficient. The data for quantification in C–G and J–N are from n = 3 independent experiments.

