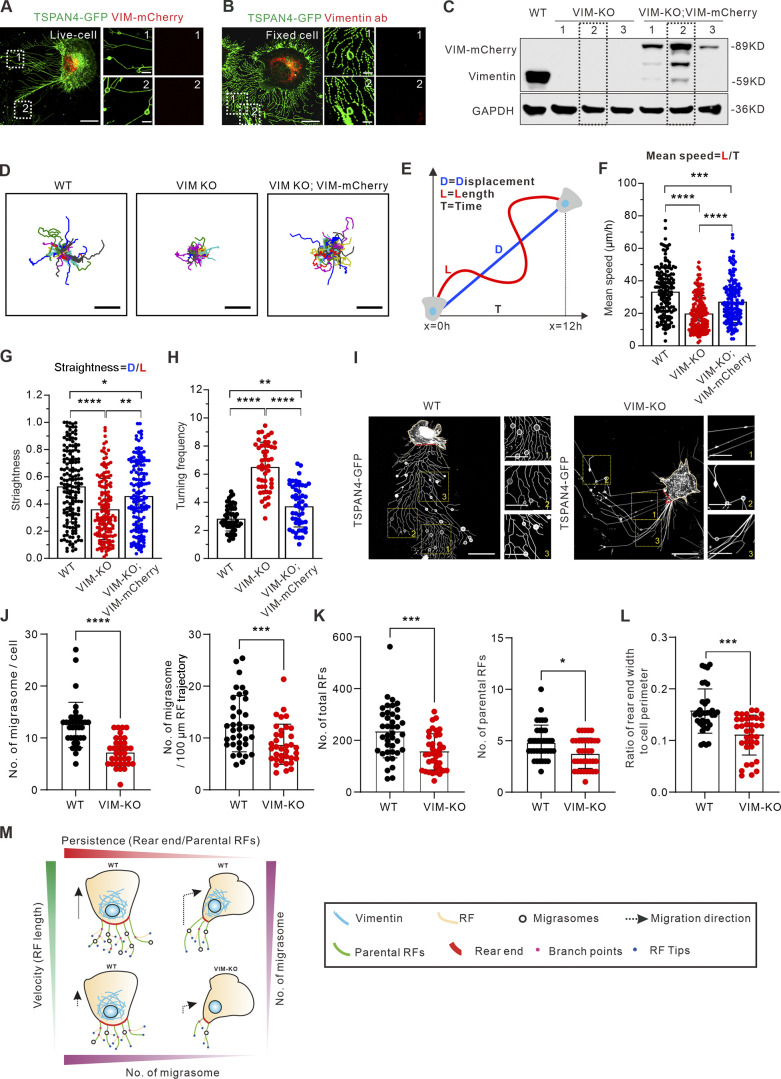
Figure 5.
Vimentin regulates migrasome formation by modulating cell migration velocity and persistence. (A) Representative snapshots of live cells show the subcellular distribution of exogenously expressed vimentin-mCherry and TSPAN4-GFP in L929 cells. The white dotted outlines represent ROIs containing RFs and migrasomes. Scale bars, 10 and 2 µm in image and magnified view, respectively. (B) Representative immunofluorescence images show the subcellular distribution of endogenous vimentin with respect to TSPAN4-GFP. The white dotted outlines represent ROIs containing RFs and migrasomes. Scale bars, 10 and 2 µm in image and magnified view, respectively. (C) Western blot analysis of the extracts of WT, VIM-KO, and VIM-KO; VIM-mCherry TSPAN4-GFP expressing L929 cells. The dashed line indicates the cell line we chose for further experiments. (D) Cell random migration trajectory of WT, VIM-KO, and VIM-KO; VIM-mCherry TSPAN4-GFP–expressing cells within 12 h. n = 15 cells. Scale bars, 100 µm. (E) Schematic diagram for the quantification of cell migration speed and straightness. (F) Quantification of the mean speed of TSPAN4-GFP WT, VIM-KO, and VIM-KO; VIM-mCherry cells. n = 150 cells. (G) Quantification of the straightness of TSPAN4-GFP WT, VIM-KO, and VIM-KO; VIM-mCherry cells. n = 150 cells. (H) Quantification of the turning frequency of TSPAN4-GFP WT, VIM-KO, and VIM-KO; VIM-mCherry cells. n = 50 cells. (I) Snapshots of live TSPAN4-GFP–expressing WT and VIM-KO L929 cells. Yellow squares indicate the magnified fields, and red lines mark the rear end. Scale bars, 20 and 10 µm in image and magnified view, respectively. (J) Quantification of the number of migrasomes per cell and per 100-μm RF trajectory in TSPAN4-GFP WT and VIM-KO L929 cells. n = 36 cells. (K) The number of total RFs and parental RFs in TSPAN4-GFP–expressing WT and VIM-KO L929 cells. n = 36 cells. (L) Quantification of the ratio of rear end width to cell perimeter in TSPAN4-GFP WT and VIM-KO L929 cells. n = 36 cells. (M) Schematic model of cell migration pattern to orchestrate migrasome formation. The data for quantification in F–H and J–L are from n = 3 independent experiments. The data are presented as mean ± SD (t test in J–L; one-way ANOVA in I–K). *, P < 0.05; **, P < 0.01; ***, P < 0.001; ****, P < 0.0001. Source data are available for this figure: SourceData F5.

