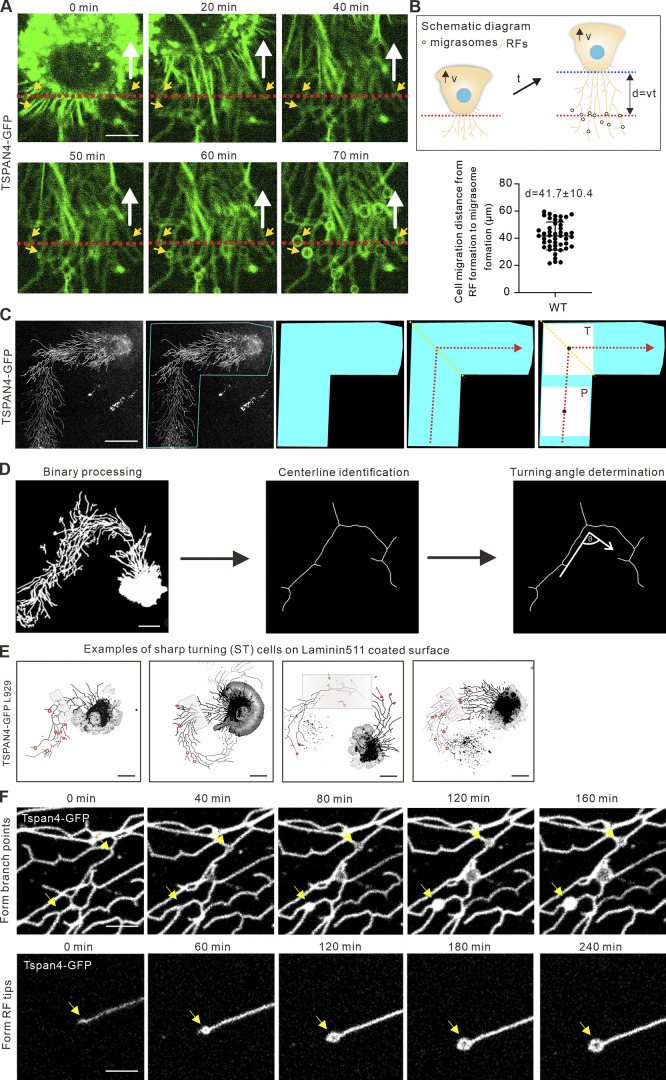
Figure S1.
Data analysis details. (A) Representative images from a time-lapse video indicate the time from RF derivation to migrasome formation in TSPAN4-GFP L929 cells. The white arrow indicates the direction of cell migration, the red dashed line denotes the position of cell rear at initial time point, and the yellow arrows indicated the position of migrasome appearance. Scale bars, 10 µm. (B) Schematic diagram and quantification of cell displacement from RF formation to migrasome appearance. Data are presented as mean ± SD; n = 48 cells. (C) Process diagram to determine the ROI of T-phase and P-phase in a sharp-turning TSPAN4-GFP L929 cell. Blue region marks the ROI of turning cell, yellow lines mark the position of turning, red lines mark the trajectory of migration, black dots mark the center of squares, and white squares mark the ROI of T-phase and P-phase. Scale bars, 20 µm. (D) Schematic diagram of the steps to define the turning angle. Scale bars, 20 µm. (E) Examples of sharp-turning TSPAN4-GFP L929 cells grown on laminin 511–coated surface. Gray boxes indicate the T-regions, and red circles indicate the migrasomes. Scale bars, 20 µm. (F) Representative images from time-lapse videos in TSPAN4-GFP L929 cells visualizing the migrasome formation process on branch points and tips of RFs. Yellow arrows indicate the position where migrasomes formed. Scale bars, 10 µm.

