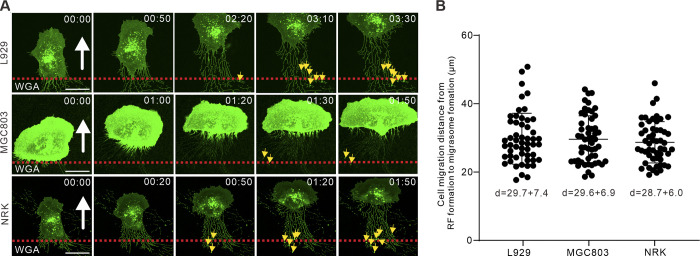
Figure S2.
Cell migration displacement from RF formation to migrasome appearance. (A) Representative images from time-lapse videos indicate the time from RF derivation to migrasome formation in WT L929, MGC803, and NRK cells. The white arrows indicated the direction of cell migration, the red dashed lines denote the position of cell rear at initial time point, and the yellow arrows indicate the position of migrasome appearance. Scale bars, 20 µm. (B) Quantification of cell displacement from RF formation to migrasome appearance. Data are presented as mean ± SD; n = 54 cells in L929, 53 cells in MGC803 and 53 cells in NRK.

