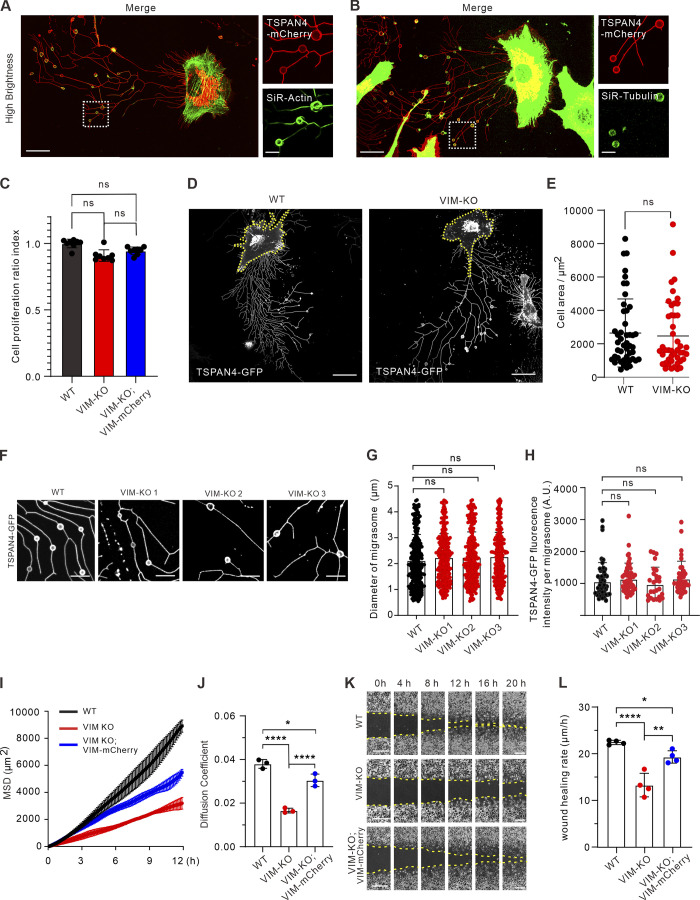
Figure S3.
Vimentin deficiency leads to defective cell migration and abnormal migrasome formation. (A) Representative images from a time-lapse video of TSPAN4-mCherry L929 cells incubated with SiR-actin. Magnified panels are the white box in the left panel. Scale bars, 20 µm. (B) Representative images from a time-lapse video of TSPAN4-mCherry L929 cells stained with SiR-tubulin. Magnified panels are the white box in the left panel. Scale bars, 20 µm. (C) Analysis of CCK8 assay in TSPAN4-GFP WT, VIM-KO, and VIM-KO; VIM-RES cells. (D) Examples of snapshots of live TSPAN4-GFP WT and VIM-KO L929 cells. Yellow dashed lines indicate the cell outlines. Scale bars, 20 µm. (E) Quantification of the cell area in TSPAN4-GFP WT and VIM-KO L929 cells. n = 47 cells. (F) Examples of RF-associated migrasomes in TSPAN4-GFP WT and VIM-KO L929 cells. Scale bars, 10 µm. (G) Quantification of the diameter of migrasomes in TSPAN4-GFP WT and VIM-KO L929 cells. n = 343 migrasomes in 23 cells. (H) Quantification of the TSPAN4-GFP intensity per migrasome in TSPAN4-GFP WT and VIM-KO L929 cells. n = 50 migrasomes in 11 cells. (I) Mean square displacement (MSD) analysis of representative trajectories per condition. n = 3 regions including 15 trajectories. (J) Diffusion coefficient (D, μm2/100 ms) was calculated from the slope of the fitted regression line derived by MSD analysis of H. n = 3 regions including 15 trajectories. (K) Examples of wound healing assay in TSPAN4-GFP WT, VIM-KO, and VIM-KO; VIM-RES cells. Scale bars, 100 µm. (L) Quantification of wound healing migration rate per condition. n = 4 independent experiments. The data for quantification in C, E, and G–L are from n = 3 independent experiments. Data are presented as mean ± SD (t test in E; one-way ANOVA in C, G, J, and K). *, P < 0.05; **, P < 0.01; ****, P < 0.0001.

