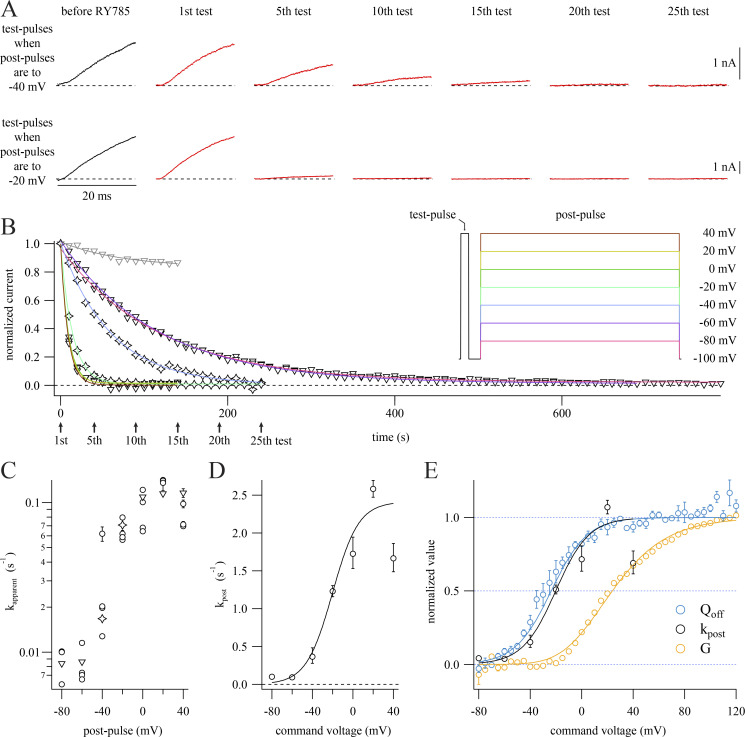
Figure 3.
RY785 inhibition rate is not proportional to K+ conductance. (A) Representative current traces from two cells subjected to the voltage protocol inset in B. Cells held at −100 mV were given a 20-ms step to +40 mV followed by a 30-ms step to −100 mV and then a 500-ms step to a voltage which varied between cells. 10 s elapsed during each cycle. Dashed lines indicate 0 current. Data from these exemplars are represented as stars in B and C. (B) Time courses of current inhibition from representative cells with postpulses to the indicated voltages. Mean currents from the final 1 ms of each test pulse (symbols) are normalized to the first test pulse in RY785. Stars correspond to exemplars shown in A. Arrows indicate time points shown in A. Function variables from fitted exponential function (Eq. 4, curves) ± SD; −80 mV, τ = 119.0 ± 01.2 s−1, I0 = 0.0211 ± 0.0016; −60 mV, τ = 116.0 ± 1.0 s−1, I0 = 0.0123 ± 0.0016; −40 mV, τ = 59.7 ± 02.0 s−1, I0 = 0.0034 ± 0.0085; −20 mV, τ = 14.13 ± 00.16 s−1, I0 = 0.0093 ± 0.0013; 0 mV, τ = 09.168 ± 00.063 s−1, I0 = 0.01323 ± 0.00083; +20 mV, τ = 08.71 ± 00.18 s−1, I0 = 0.0162 ± 0.0024; +40 mV, τ = 08.62 ± 00.59 s−1, I0 = 0.0017 ± 0.0080; vehicle control (gray), +20 mV, τ = 74 ± 21 s−1, I0 = 0.832 ± 0.023. (C) Apparent rates of inhibition (kapparent) plotted against postpulse voltage. kapparent ± SD from fits to individual cells. Stars and triangles correspond to exemplars shown in A and B. (D) Relation of RY785 inhibition rate during the postpulse (kpost) to postpulse voltage. Geometric mean rate ± SEM (circles) calculated from cells in C. Boltzmann function fitted to RY785 inhibition rates (curve). Function variables ± SD: x held at 1. Vhalf = −20.2 ± 4.9 mV, z = 1.97 ± 0.30 e0, A = 2.41 ± 0.24 s−1. (E) Comparison of RY785 inhibition rates to Kv2.1 G–V relation (yellow) and OFF gating charge–voltage (QOFF–V) relation (blue). Means ± SEM. G–V from cells in vehicle, n = 4 cells. QOFF–V replotted from a prior publication (Tilley et al., 2019). Amplitudes normalized to fitted Boltzmann functions (Eq. 2), shown as solid curves. Function variables ± SD; QOFF, x set to 1, Vhalf = −23.7 ± 1.6 mV, z = 1.81 ± 0.12 e0; G, x set to 4, Vhalf = −19.95 ± 0.73 mV, z = 0.968 ± 0.020 e0.

