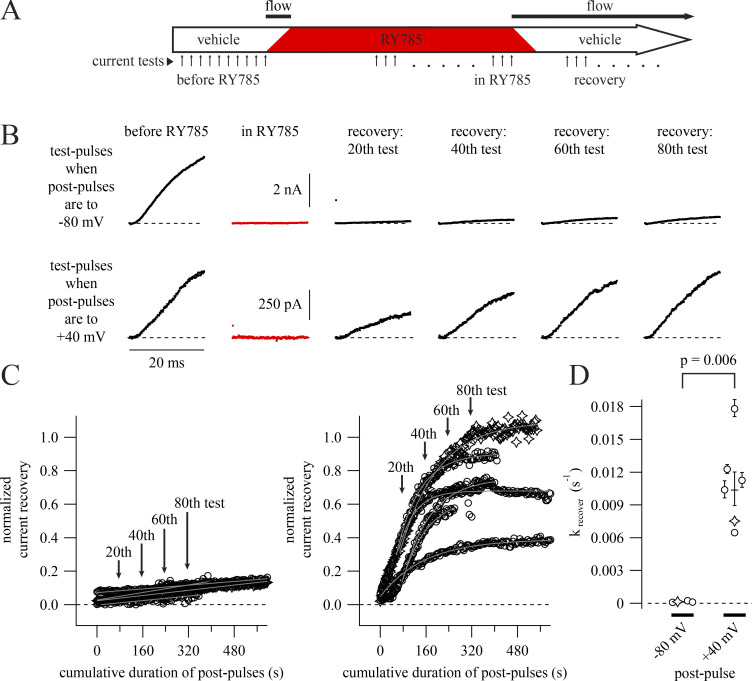
Figure 5.
Negative membrane potential slows RY785 dissociation. (A) Cartoon timeline of experiments. The number of voltage protocol cycles used to inhibit and recover Kv2.1 currents varied between cells. (B) Representative current traces from two cells. Dashed lines indicate zero current. Data from these cells are represented as stars in C and D. (C) Time courses of current recovery with postpulses to −80 (left) or +40 (right) mV. Mean currents from the final 1 ms of each test pulse, normalized to before RY785 wash-in, are shown as symbols. Arrows indicate time points shown in B. Time courses at −80 mV (left, n = 4) are fitted with gray lines. Time courses at +40 mV (right, n = 6) are fitted with single exponential functions (Eq. 4, gray curves). (D) Category plot showing current recovery rates at two voltages. Rates were calculated from the fits in C. Geometric means ± SEM are shown as horizontal lines.

