Figure 6.
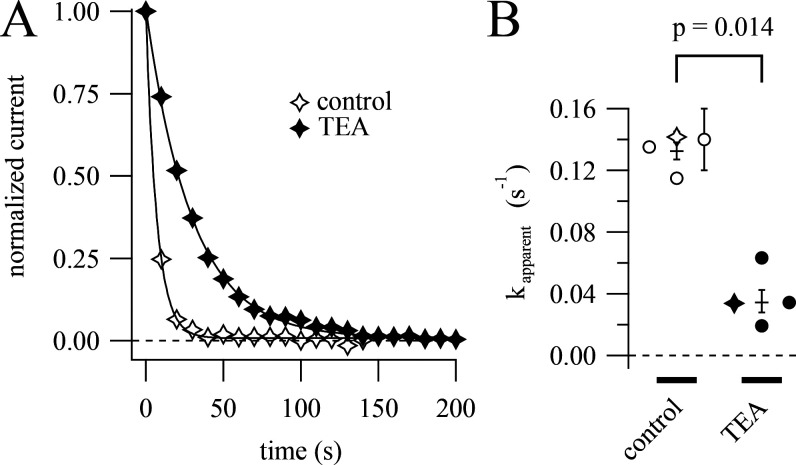
Intracellular TEA competes with RY785. (A) Time courses of current inhibition by 1 µM RY785 from cells with postpulses to +20 mV. Mean currents from the final 1 ms of each test pulse (symbols), normalized to the first test pulse in RY785. Time courses from a representative control cell (open symbols) and a representative cell pretreated with 2 mM intracellular TEA (closed symbols). Time courses are fitted with exponential functions (Eq. 4). Data from these cells are represented as stars in B. (B) Apparent RY785 inhibition rates ± TEA. Rates ± SD from fits to individual cells (symbols). Geometric means ± SEM are shown as horizontal lines.

