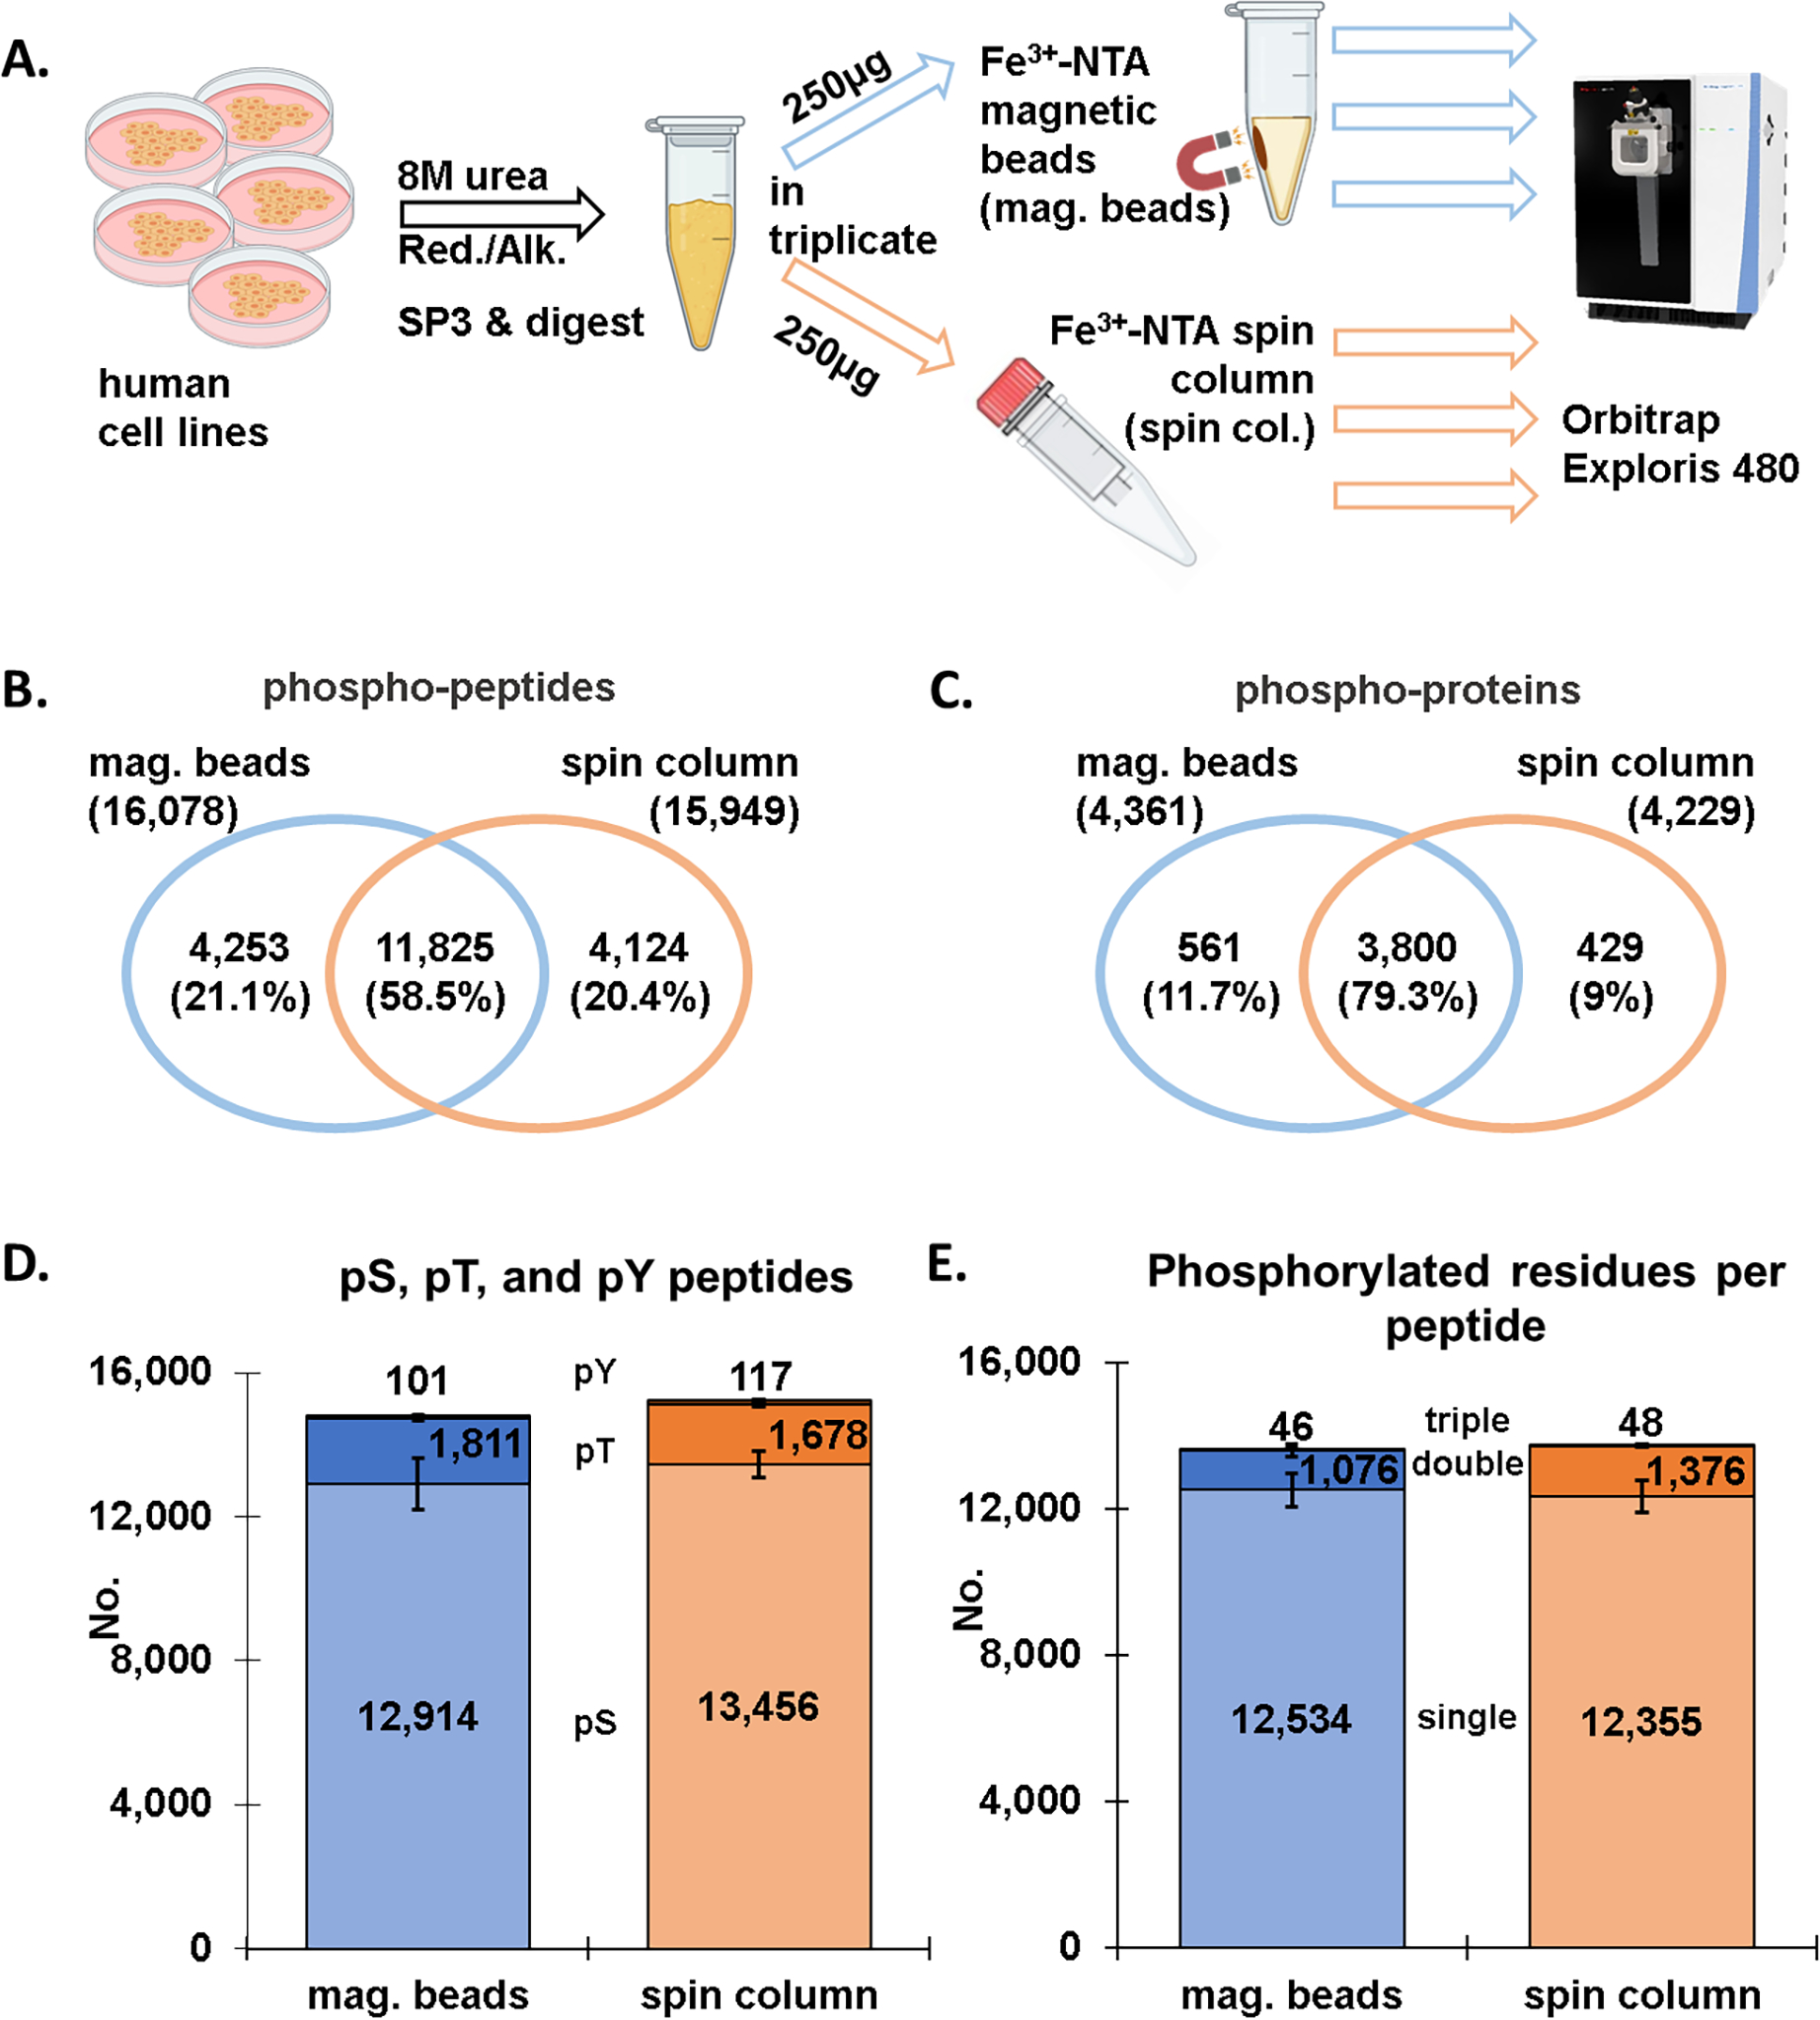
Figure 1: Comparison of magnetic bead and spin column workflows for phosphopeptide enrichment (label-free dataset).

A) Overview of the phosphopeptide enrichment workflow in which aliquots of the identical sample were enriched by either Fe3+-NTA magnetic beads or Fe3+-NTA spin columns. Venn diagrams show the overlap in B) phosphopeptides and C) phosphoproteins between the Fe3+-NTA magnetic bead and the Fe3+-NTA spin column workflows. D) Bar graph illustrating the number of phosphorylated serine, threonine, and tyrosine (pSer, pThr, pTyr) for both enrichment methods. E) Bar graph depicting the number of singly, doubly, and triply phosphorylated peptides for the two enrichment methods. Error bars represent standard deviation.
