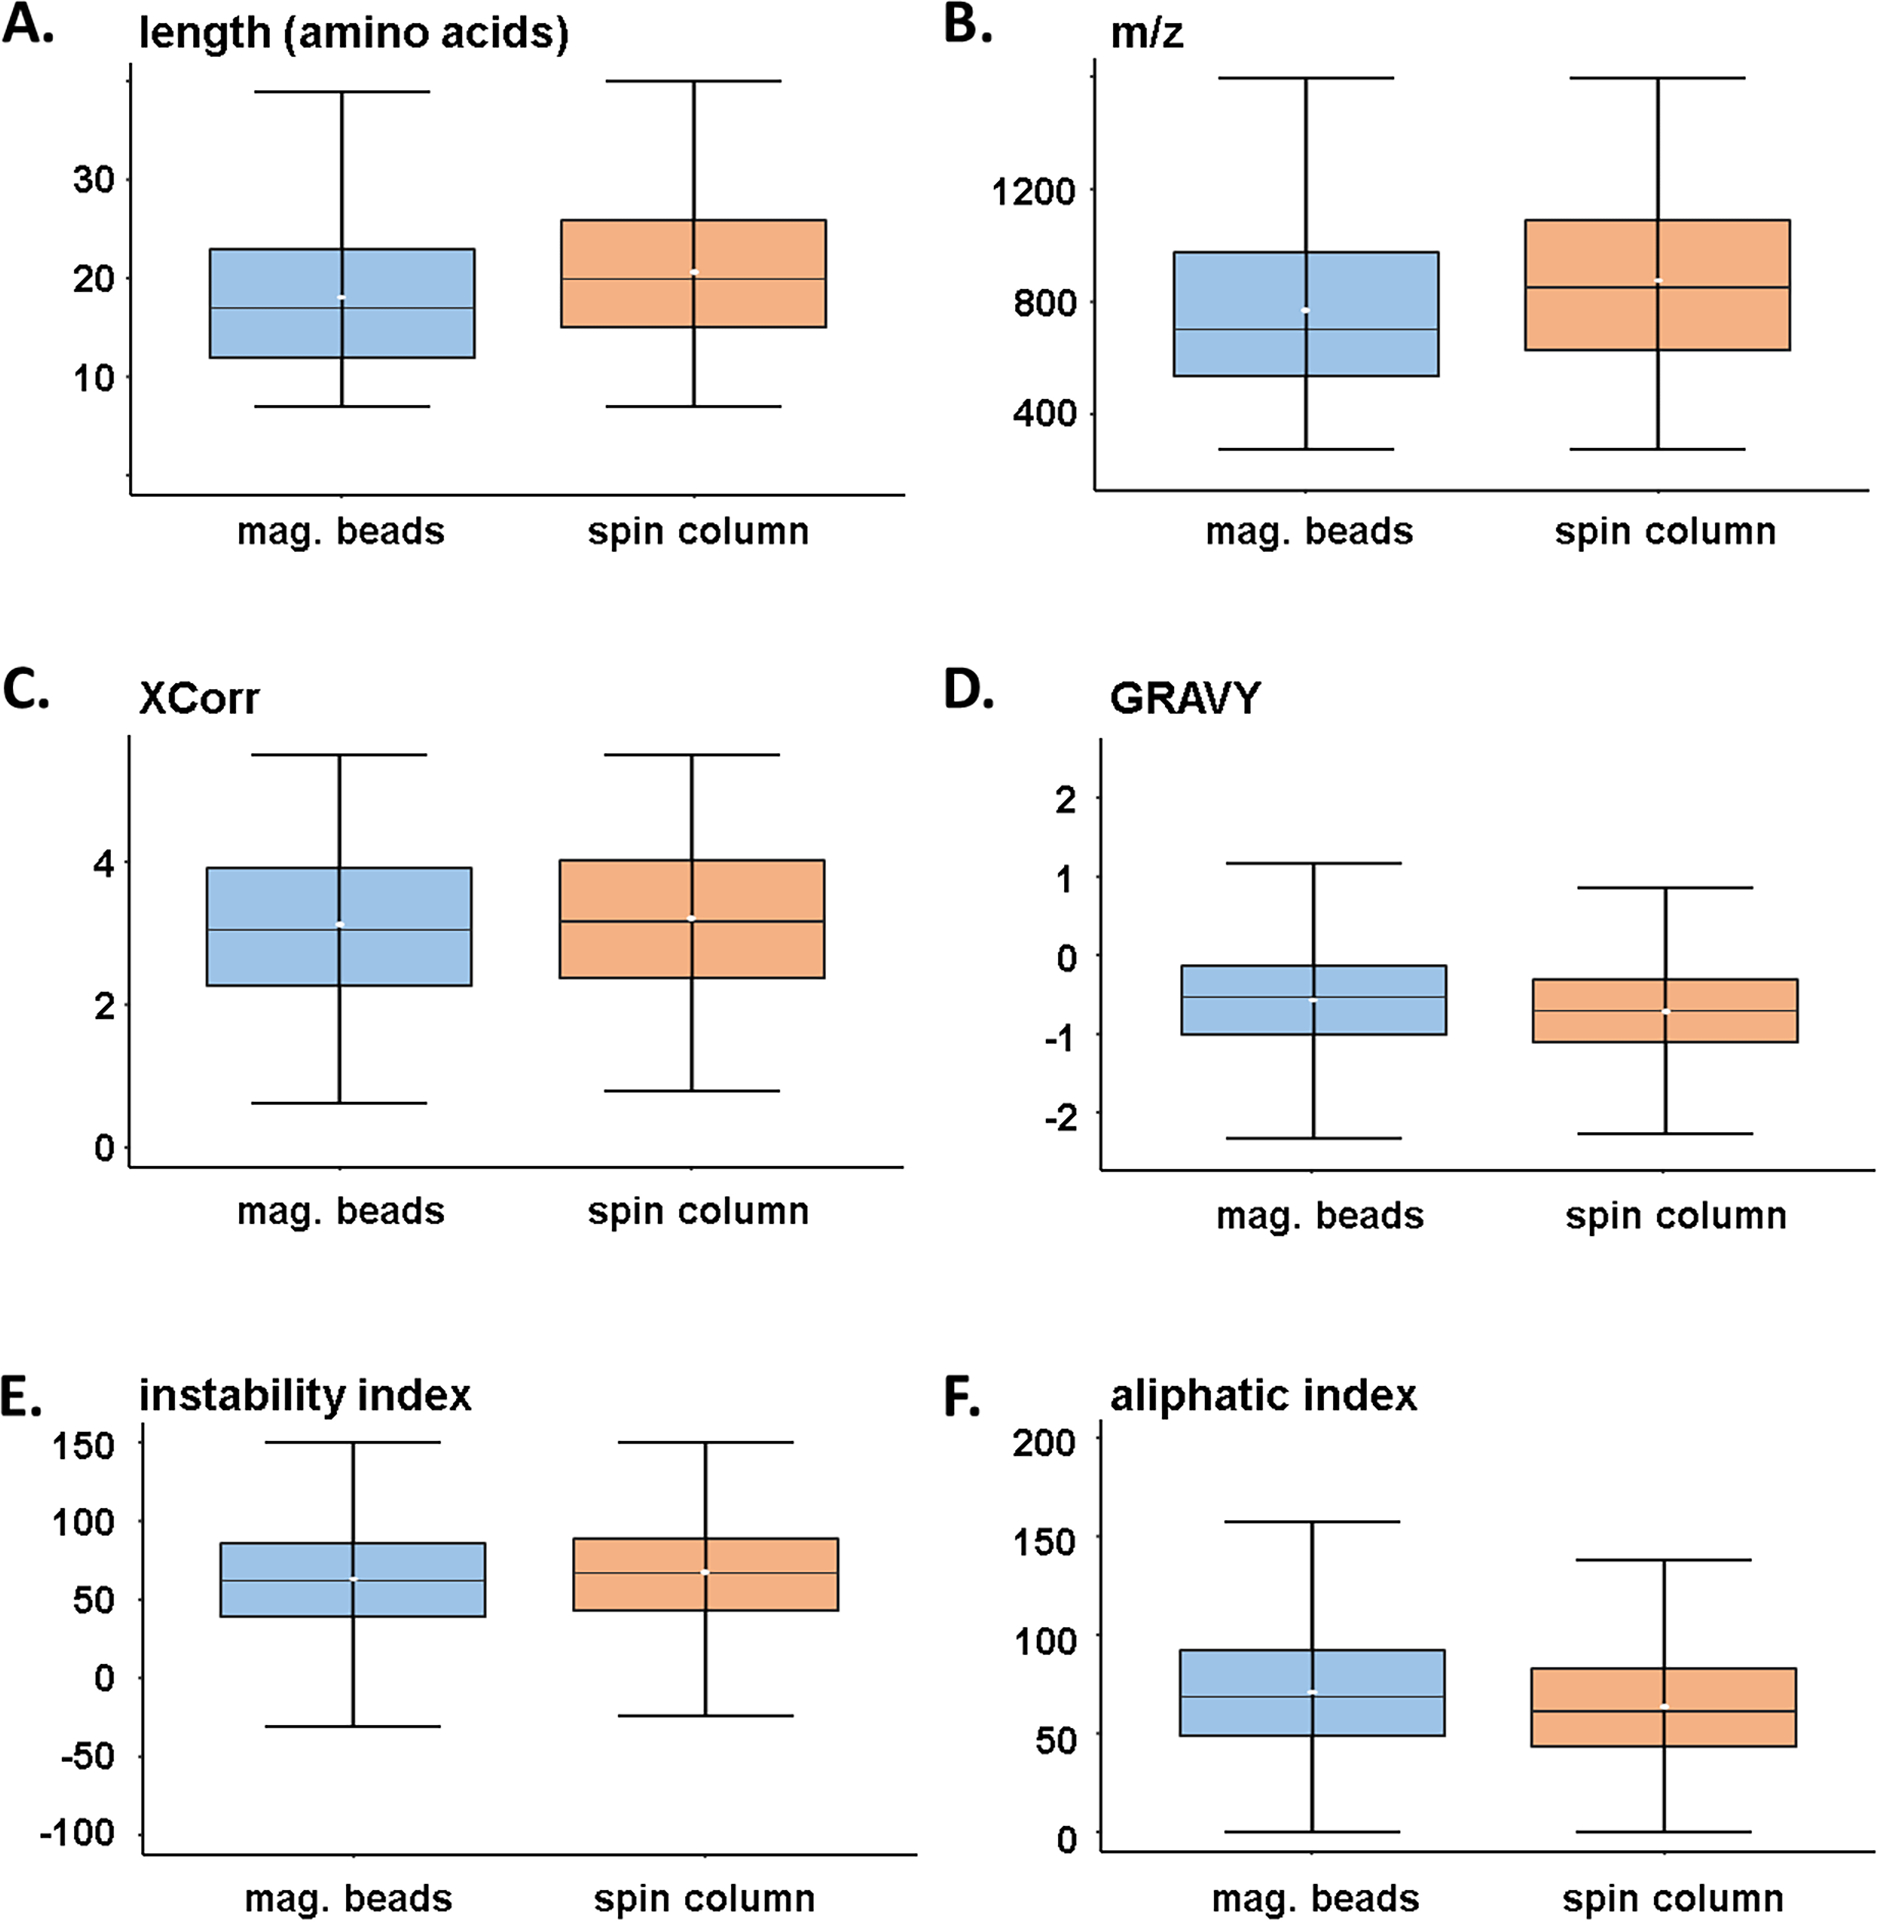
Figure 2: Peptide characteristics of workflow-specific label-free phosphopeptides.

Box-and-whisker plots illustrating the distribution of A) peptide length, B) mass-to-charge ratio, C) XCorr, D) GRAVY (Grand Average of Hydropathy) index, E) instability index, and F) aliphatic index. Only phosphopeptides that were exclusive to a given workflow were compared (n=4,254 for the magnetic bead strategy and n=4,124 for the spin column strategy). The center line specifies the median; box limits indicate the 25th and 75th percentiles; whiskers extend 1.5 times the interquartile range from the 25th and 75th percentiles and the white dot in the box indicates the mean value.
