Figure 4.
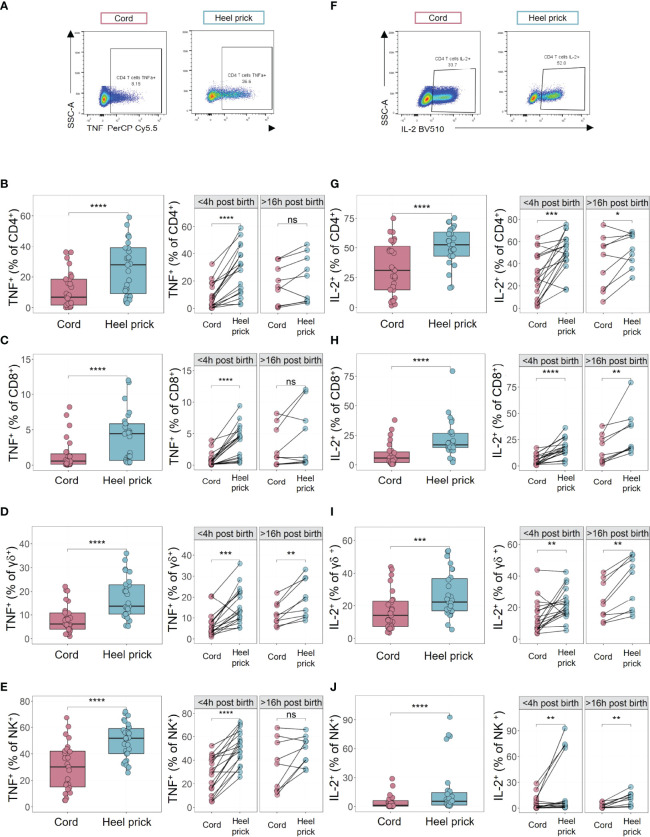
Elevated percentages of cytokine-expressing immune cells observed immediately post birth. Cytokine production was measured by multiparametric flow cytometry in mononuclear cells isolated from cord blood or paired heel prick samples in response to polyclonal stimulation [PMA (10 ng/ml), ionomycin (1 μg/ml), brefeldin A (20 ng/ml) and monensin solution (2 μM) at 37 °C for 4 h]. (A) Representative flow plots of TNF in CD4+ T cells from cord and heel prick samples. (B–E) The percentage of TNF expressing cells in CD4+ (B), CD8+ (C) and γδ+ (D) and NK (E) cells from cord blood (n=28) compared to heel prick samples collected <4 h (n=18) or >16 h post birth (n=10). (F) Representative flow plots of IL-2 in CD4+ T cells from cord and heel prick samples. (G–J) The percentage of IL-2 expressing cells in CD4+ (G), CD8+ (H) and γδ+ (I) and Natural Killer (NK) (J) cells from cord blood (n=28) compared to heel prick samples collected <4 h (n=18) or >16 h post birth (n=10). Box and whisker plots follow standard Tukey representations and indicate the median (central line), the interquartile range (upper line = 75th percentile, lower line = 25th percentile), and the whiskers represent 1.5 x 75th/25th percentile. P values (***p<0.001, ****p<0.0001) for all paired data between cord and heel prick samples were assessed using two-sided paired Wilcoxon tests. *p<0.05, **p<0.01, ns, non-significant.

