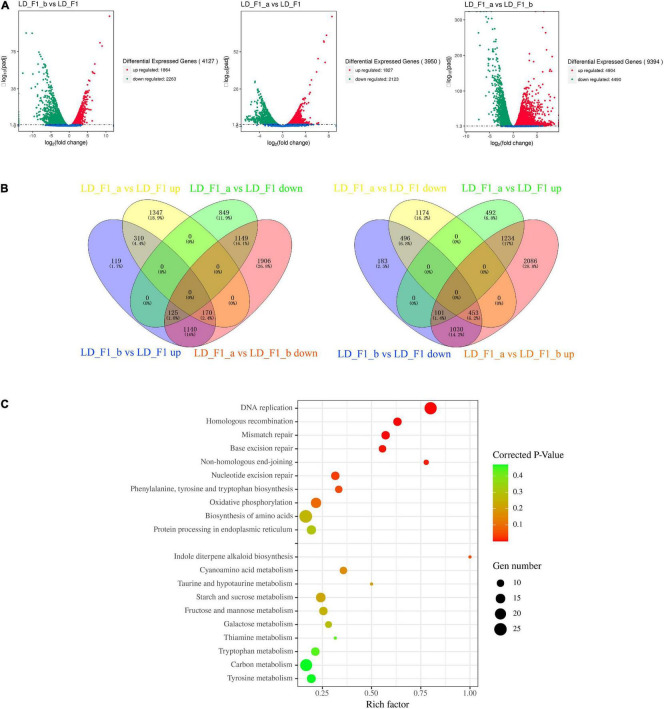
FIGURE 10.
Aspergillus flavus genes that were differentially expressed in response to AfPV1 and Satellite RNA that were identified by RNA-Seq. (A) Volcano plot of RNA-Seq data using Log 2 fold change and Log 10 (padj). X and Y axes represent Log 2 -converted fold change and Log 10 -converted padj. (B) Venn diagrams illustrating the number of genes that were differentially expressed in subsets of the virus-free isolate (LD-F1), AfPV1-infected isolate (LD-F1-b), and AfPV1- and SatRNA-infected isolate (LD-F1-a). (C) Bubble chart for KEGG pathway enrichment analysis of different expression in response to AfPV1 and Satellite RNA.

