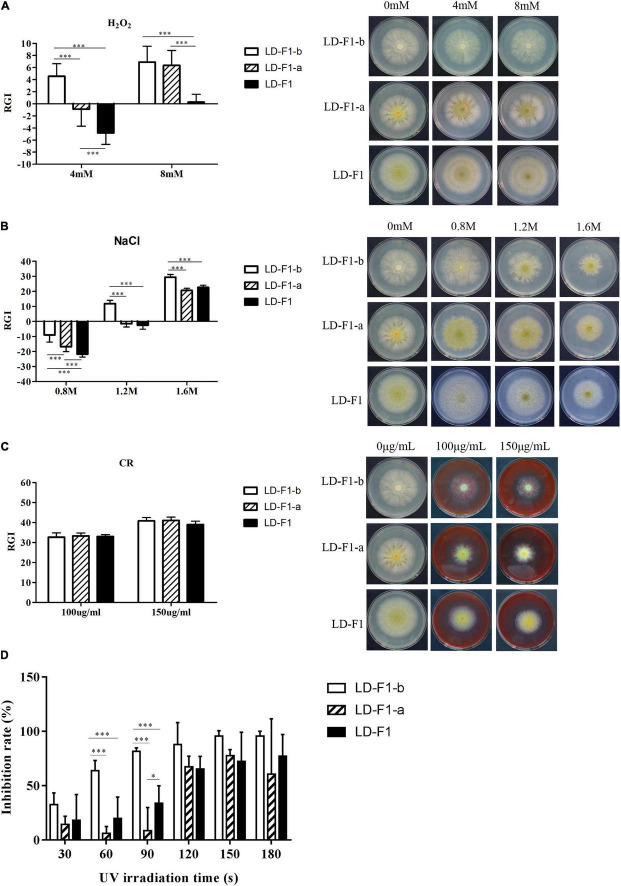
FIGURE 4.
Comparisons of tolerance to stresses by virus-free isolate (LD-F1), AfPV1-infected isolate (LD-F1-b), and AfPV1- and SatRNA-infected isolate (LD-F1-a). Radial growth inhibition under oxidative stress (A), osmotic stress (B), cell wall stress (C), UV stress (D). *P < 0.05, **P < 0.01, ***P < 0.001, by Tukey’s multiple comparison tests.

