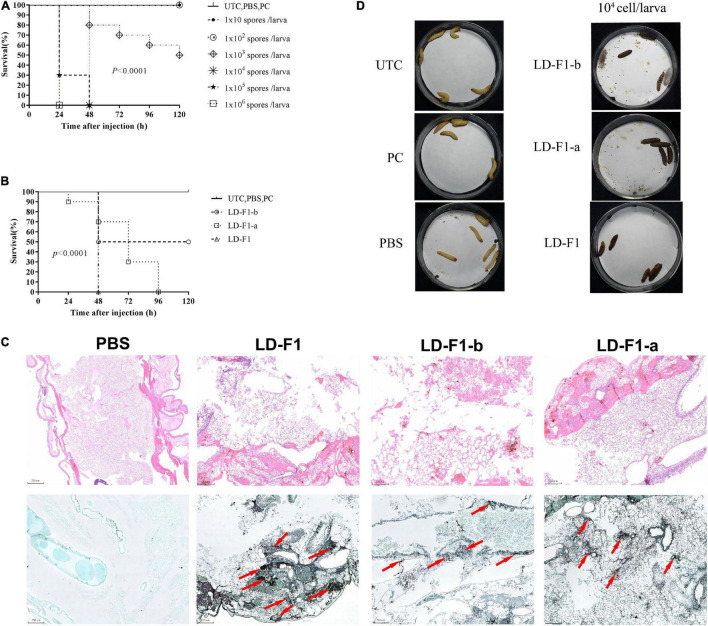
FIGURE 6.
(A) Determination of the optimal spore concentration of A. flavus for pathogenicity testing in G. mellonella. The G. mellonella larvae were injected with spores of A. flavus isolate LD-F1 using 10, 102, 103, 104, 105, and 106 spores per larva. (B) Survival of G. mellonella larvae infected with 105 spores/larva of virus-free isolate (LD-F1), AfPV1-infected isolate (LD-F1-b), and AfPV1- and SatRNA-infected isolate (LD-F1-a) over a 120 h incubation period. (C) Histological observation at 48 h post-inoculation among tissues infected with the virus-free isolate (LD-F1), AfPV1-infected isolate (LD-F1-b), and AfPV1- and SatRNA-infected isolate (LD-F1-a), and the HE staining is on top, while the GMS staining is below, and the red arrows indicate hyphae growth. (D) Melanization of larvae infected with the virus-free isolate (LD-F1), AfPV1-infected isolate (LD-F1-b), and AfPV1- and SatRNA-infected isolate (LD-F1-a). Control experiments are comprised of non-treated larvae (UTC), pierced larvae (PC), and PBS-injected larvae (PBS). P-values were estimated using Log rank tests.

