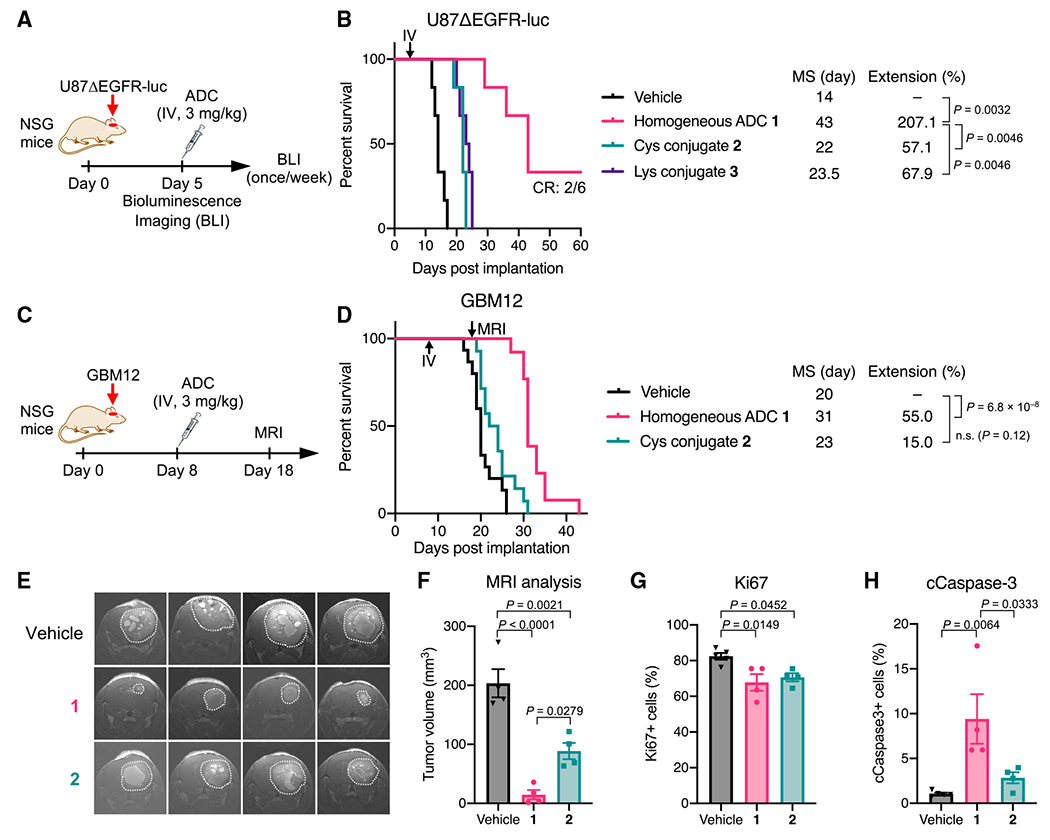
Figure 2. ADC homogeneity enhances therapeutic efficacy in orthotopic GBM mouse models.

(A) Study schedule in the U87ΔEGFR-luc xenograft model (male and female NSG mice).
(B) Survival curves in the U87ΔEGFR-luc model (n = 6/group). p values were calculated using a log rank test with a Bonferroni correction.
(C) Study schedule in the GBM12 PDX model (male and female NSG mice).
(D) Survival curves in the GBM12 model (n = 15 for vehicle; n = 14 for ADCs). p values were calculated using a log rank test with a Bonferroni correction.
(E) Coronal magnetic resonance (MR) images on day 18 (n = 4). Tumor lesions are indicated with white dots.
(F) Estimated tumor volume by MR image-based quantification (mean values ±SEM; n = 4). One-way ANOVA with a Tukey-Kramer post hoc test was used for statistical analysis.
(G and H) Populations of Ki67-positive cells (G) and cCaspase-3-positive cells (H) in the GBM12 tumors harvested at the terminal stage (mean values ±SEM; n = 5 for vehicle, n = 4 for ADCs). One-way ANOVA with a Tukey-Kramer post hoc test was used for statistical analysis.
