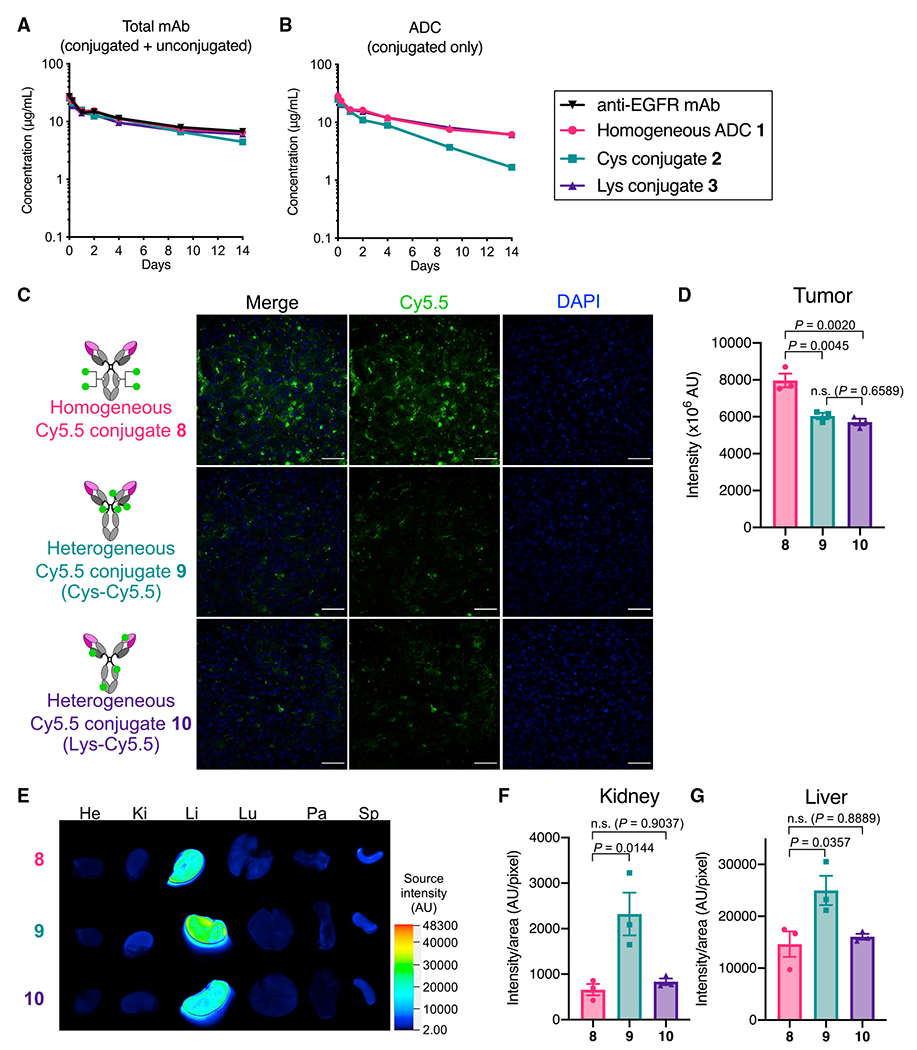
Figure 4. Promoted clearance and premature payload loss in circulation are not the primary factors attenuating the brain-tumor-targeting efficiency of ADCs.

(A and B) PK of unmodified N88A/N297A anti-EGFR mAb and ADCs 1–3 in female CD-1 mice (n = 3). Concentrations of total antibody (both conjugated and unconjugated, A) and ADC (intact ADC-equivalent dose, B) were determined by sandwich ELISA (mean values ± SEM).
(C) Fluorescence images of brain tumor tissues harvested 48 h after injecting each Cy5.5 conjugate to male and female NSG mice bearing orthotopic U87ΔEGFR tumors (representative of three independent experiments, scale bar: 50 μm).
(D) Semi-quantification of the Cy5.5 signal detected in the brain tumor tissues. Three regions of interest (ROIs) were randomly selected in each tissue sample to calculate signal intensity (mean values ± SEM). One-way ANOVA with a Tukey-Kramer post hoc test was used for statistical analysis.
(E) Ex vivo fluorescence images of the other organs (He, heart; Ki, kidney; Li, liver; Lu, lung; Pa, pancreas; Sp, spleen). A representative result of three independent experiments is shown.
(F and G) Semi-quantification of the Cy5.5 signal detected in the kidneys and liver (mean values ± SEM). One-way ANOVA with a Tukey-Kramer post hoc test was used for statistical analysis.
