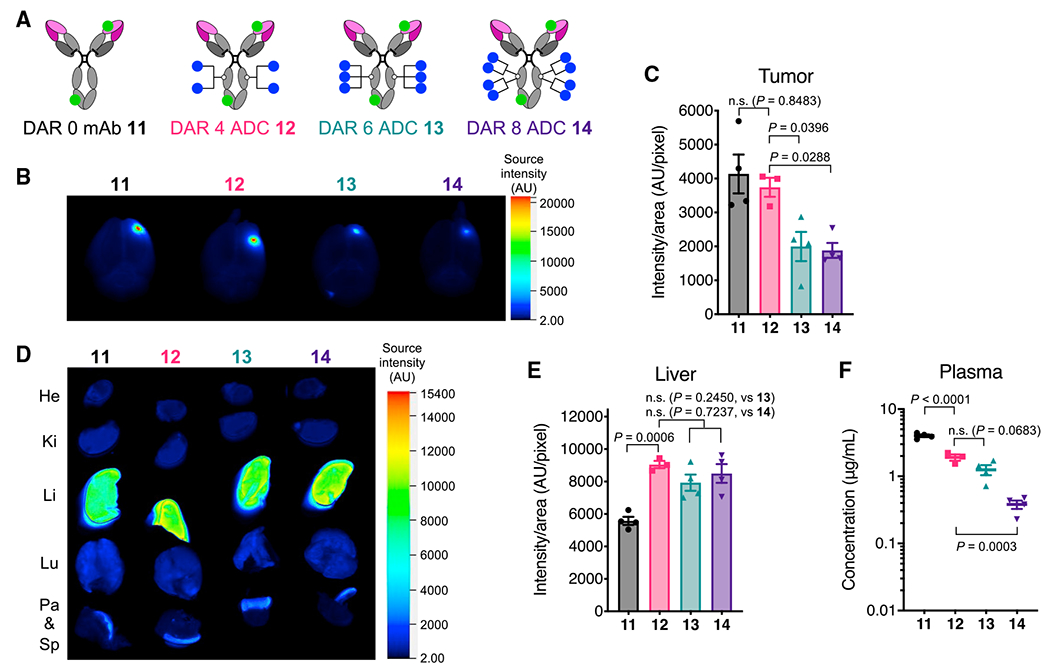
Figure 6. High-DAR components in heterogeneous ADCs target brain tumors less efficiently than components with optimal or low DAR.

(A) The structures of fluorescently labeled anti-EGFRvIII ADCs equipped with MMAF (blue circle) at DARs of 0, 4, 6, and 8. Cy5.5 (green circle) was conjugated by lysine coupling at DOL of 2.3–2.5.
(B) Representative ex vivo fluorescence images of whole brains harvested from male NSG mice bearing orthotopic U87ΔEGFR-luc tumors 48 h after intravenous injection of each fluorescent ADC (n = 3 for DAR 4 ADC 12; n = 4 for all other groups).
(C) Semi-quantification of the Cy5.5 signal derived from the tumor lesions in the whole brains (mean values ± SEM, n = 3 for DAR 4 ADC 12; n = 4 for all other groups). One-way ANOVA with a Dunnett’s post hoc test (control: DAR 4 ADC 12) was used for statistical analysis.
(D) Representative ex vivo fluorescence images of other major organs (n = 3 for DAR 4 ADC 12; n = 4 for all other groups).
(E) Semi-quantification of the Cy5.5 signal detected in the liver (mean values ± SEM; n = 3 for DAR 4 ADC 12, n = 4 for all other groups). One-way ANOVA with a Dunnett’s post hoc test (control: DAR 4 ADC 12) was used for statistical analysis.
(F) Concentrations of total antibody in plasma collected right before cardiac perfusion (mean values ± SEM; n = 3 for DAR 4 ADC 12, n = 4 for all other groups). One-way ANOVA with a Dunnett’s post hoc test (control: DAR 4 ADC 12) was used for statistical analysis.
