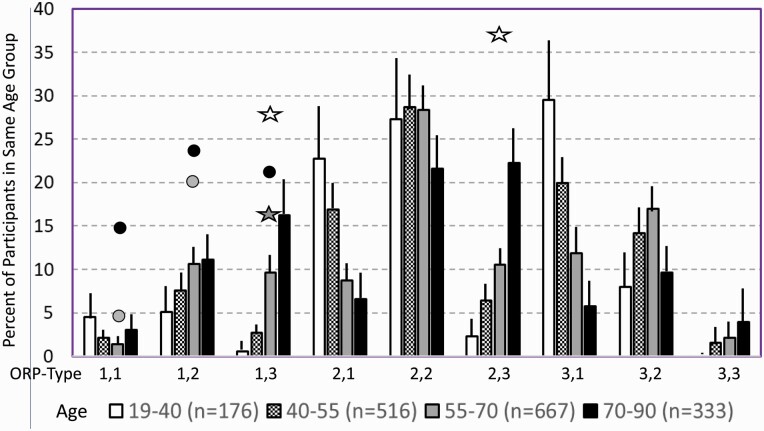
Figure 9.
Prevalence of different ORP types in different age groups of participants with “No OSA/Insomnia” in both cohorts (Twins and Sleep Heart Health Study). Lines are upper margin of error (95% confidence interval). Solid circles, values found in participants with severe (grey circle), and very severe OSA (black circles) in the different ORP types (From Table 3). White stars, values found in participants with insomnia and short sleep duration (From Table 3). Dark stars, values found in participants with insomnia plus OSA (from Table 3). All symbols are plotted against the 55–70 age group (grey columns) since average age in all clinical groups fell in this range. Where no symbols are shown above a given ORP type, the prevalence of the type is within the confidence interval of participants with no OSA or insomnia.

