
Figure 5.
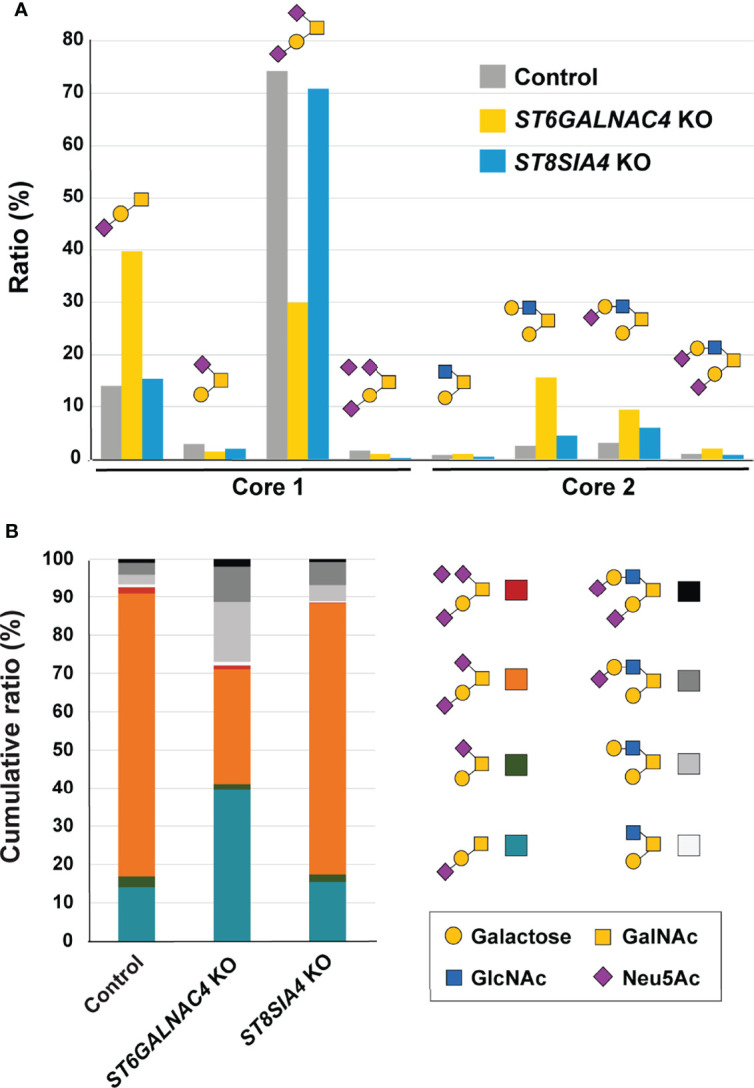
ST6GalNAc-IV is responsible for the biosynthesis of disialyl-T in JVM-3 cells. (A) O-glycans were released by reductive elimination from control (gray), ST6GALNAC4 KO (yellow), and ST8SIA4 KO (blue) JVM-3 cells; permethylated; and subjected to liquid chromatography with tandem mass spectrometry analysis. Except for monosialyl-T (Neu5Acα2–3Galβ1–3GalNAcα1– or Galβ1–3[Neu5Acα2–6]GalNAcα1–), which could be resolved by liquid chromatography into two distinct isomeric structures, and trisialyl-T, which consisted of two unresolved positional isomers (Neu5Acα2–3Galβ1–3[Neu5Acα2–8Neu5Acα2–6]GalNAcα1– and Neu5Acα2–8Neu5Acα2–3Galβ1–3[Neu5Acα2–6]GalNAcα1–), each of the other O-glycans was found to be represented by a single dominating structure, as determined by tandem mass spectrometry and annotated accordingly using the Symbol Nomenclature for Glycans (52). Relative abundance was calculated from the peak areas of extracted ion chromatograms and normalized to the percentage total. Disruption of ST6GALNAC4 resulted in a reduction in the disialyl-T (Neu5Acα2–3Galβ1–3[Neu5Acα2–6]GalNAcα1–) structure and a concomitant increase in the monosialyl-T (Neu5Acα2–3Galβ1–3GalNAcα1–) and core 2 (e.g., Galβ1–3[Galβ1–3GlcNAcβ1–6]GalNAcα1–) structures. Disruption of ST8SIA4 resulted in the loss of the trisialyl-T structure. (B) Stacked bar chart of the same data shown in panel (A), along with the color code used for each of the eight major O-glycans identified and quantified.