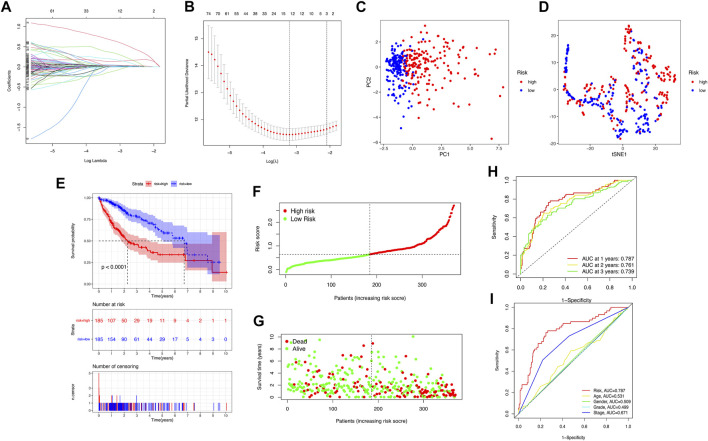
FIGURE 2.
Construction of the pyroptosis-related lncRNA prognostic model for predicting prognosis of HCC patients. (A) Twelve pyroptosis-related lncRNA signatures were selected by LASSO Cox models. (B) Cross-validation for tuning parameter selection in the LASSO model. (C,D) Principal component analysis (PCA) and t-distributed stochastic neighbor embedding (t-SNE) analysis between the high- and low-risk groups. (E) The Kaplan–Meier curve survival analysis between the high- and low-risk groups. (F,G) The risk score distribution and survival status distribution of HCC patients in two risk groups. (H) ROC analysis for OS prediction including 1, 2, and 3 years of HCC patients in the training set. (I) ROC curve analysis compares the predictive power of risk score and other clinicopathological parameters.

