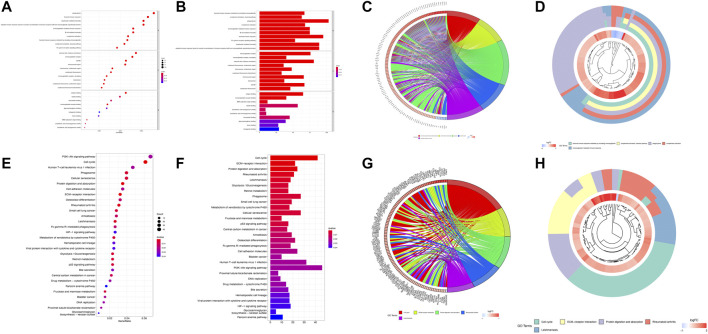
FIGURE 5.
Functional analysis based on the DEGs between the high- and low-risk groups. The bubble plot (A), barplot (B), circular plot (C), and cluster plot (D) of the GO pathways enriched for the pyroptosis-related DEGs between the high- and low-risk groups. The bubble plot (E), barplot (F), circular plot (G), and cluster plot (H) of KEGG pathways enriched for the pyroptosis-related DEGs between the high- and low-risk groups.

