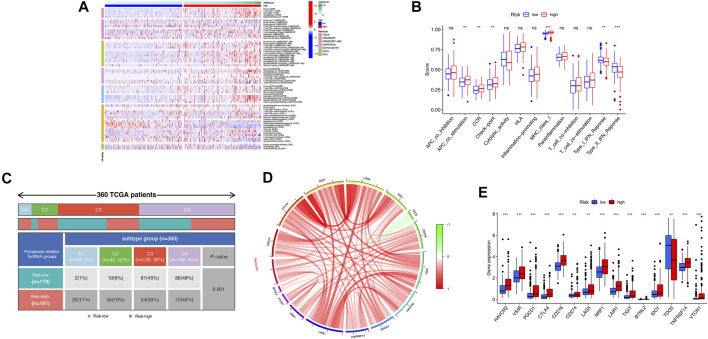
FIGURE 7.
Correlation analysis was performed between the risk model and immune status. (A) The association between immune cell infiltration and the risk score using the different algorithms. (B) The boxplot illustrating the difference in immune-related functions between the high- and low-risk groups. (C) Comparison in the differences in immune subtype between different risk groups. (D) Chord diagram illustrating the correlations between the expression of 15 key immune checkpoint genes, as well as between the mRNA expression of 15 key immune checkpoint and the risk score. (E) The boxplot displaying the difference in immune checkpoint genes between the high- and low-risk groups. ns, not significant; *p < 0.05; **p < 0.01; ***p < 0.001.

