FIGURE 9.
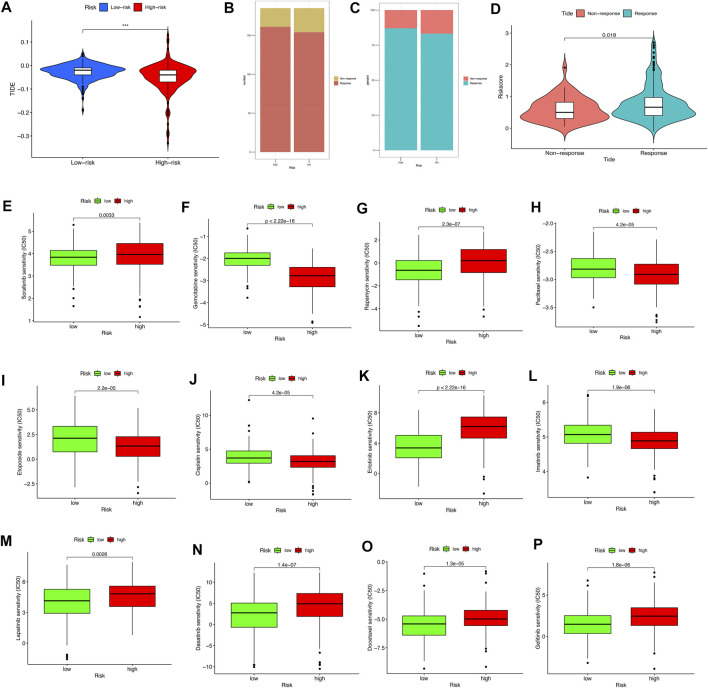
The relationship between the different risk groups and chemotherapeutic efficacy. (A) Comparison of the Tumor Immune Dysfunction and Exclusion (TIDE) prediction scores in the low- and high-risk groups. (B,C) Distribution and percentage of immunotherapy response among risk groups of HCC patients. (D) Comparison of risk scores between the response group and the nonresponse group. (E–P) Sensitivity analysis of drugs between different risk groups.

