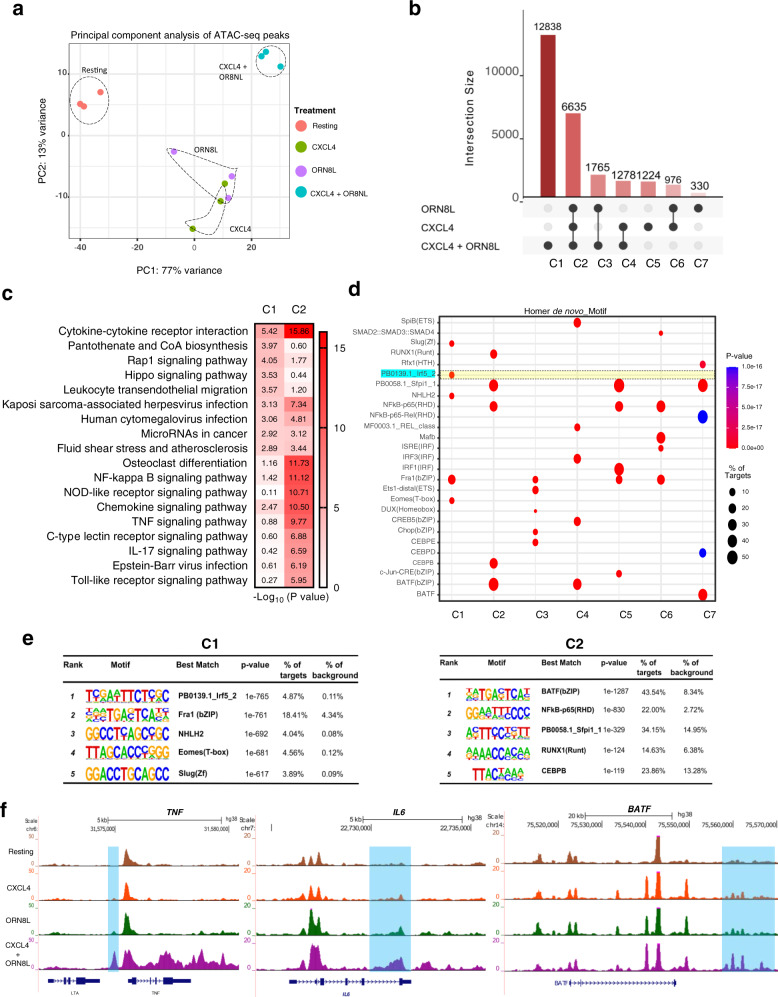
Fig. 5. CXCL4 and TLR8 costimulation induces unique open chromatin regions.
a Principal component analysis (PCA) of a total of 76,8381 consensus ATAC-peaks for Resting, CXCL4, ORN8L, and (CXCL4 + ORN8L) treatments. b UpSet plot identifying distinct and overlapping open chromatin regions. Y-axis depicts the number of peaks and X-axis grouping of peaks by Clusters C1–C7. c Functional enrichment analysis by Cistrome-GO of C1 and C2 peaks from (b). d Dot plot representation of top five motifs identified by HOMER de novo motif analysis of C1–C7 peaks. The dot size represents the percentage of peaks with the corresponding motif, and color represents significance (p-value). e HOMER known motif analysis showing the top 5 significantly enriched motifs for C1 and C2. f UCSC genome browser tracks of normalized ATACseq signal at the TNF, IL6, and BATF loci. ATACseq analysis (a–f) is based on 3 independent experiments.

