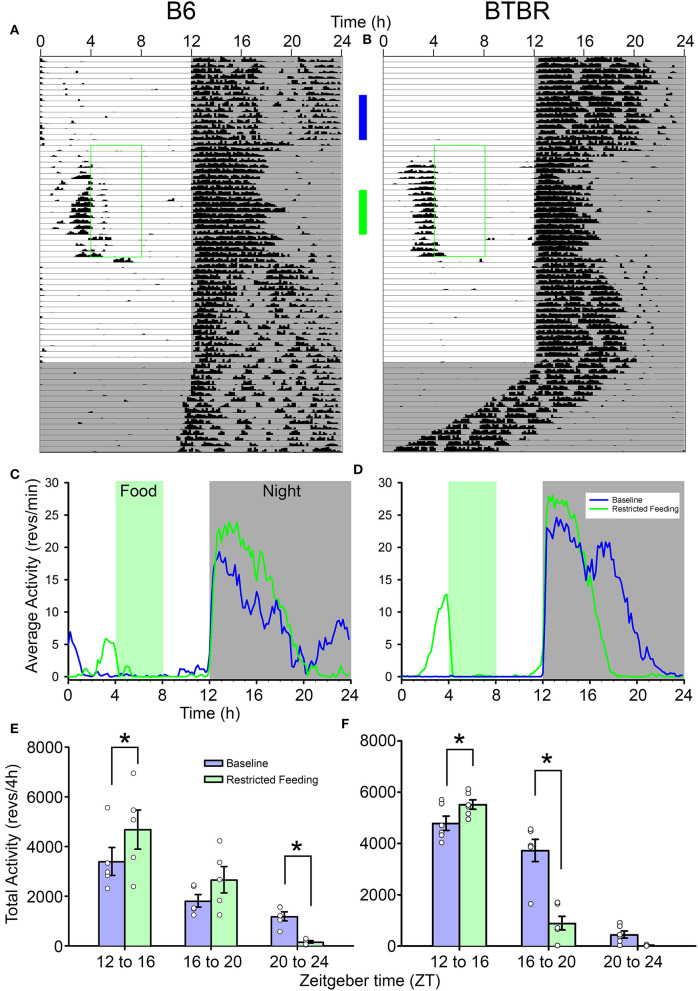
Figure 1.
Representative actograms from (A) a B6 mouse and (B) a BTBR mouse. The green box on each indicates the time of restricted food access. The vertical blue and green bars between the actograms indicated the approximate days used for the analyses presented in (C–F). Average waveforms from 7 days of activity during baseline (blue) and restricted feeding (green) are presented for B6 mice (C) and BTBR mice (D). The green rectangle denotes the time of food access during the restricted feeding portion of the study. The average total activity in the early-night (ZT12-16) mid-night (ZT16-20), and late-night (ZT20-24) are presented for both baseline (blue) and restricted feeding (green) for both B6 (E) and BTBR (F) mice. Activity levels in the early-night are significantly increased when on restricted feeding, while activity levels are significantly decreased in the mid-night for BTBR mice and the late-night for B6 mice. *p < 0.05.

