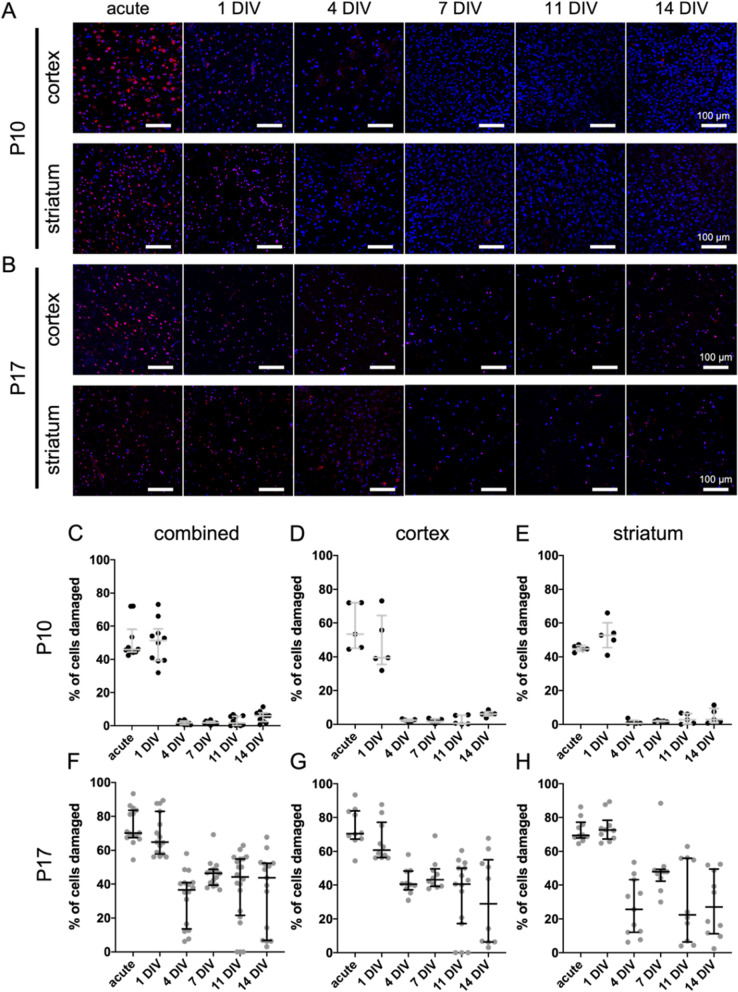
Fig. 3.
Propidium iodide imaging in normal control P10 and P17 slices through 14DIV. Representative 40x images of either (A) P10 or (B) P17 brain slices taken at acute, 1DIV, 4DIV, 7DIV, 11DIV, and 14DIV timepoints. Images are split into two rows for each age. Top row: cortex; bottom row: striatum. Error bars: 100 μm. C-H Quantification of propidium iodide imaging in normal control P10 and P17 slices through 14DIV. Profiles for P10 slices are given for (C) all data combined, (D) the cortex, and (E) the striatum. P17 profiles are given for (F) all data combined, (G) the cortex, and (H) the striatum. Error bars represent the median ± IQR

