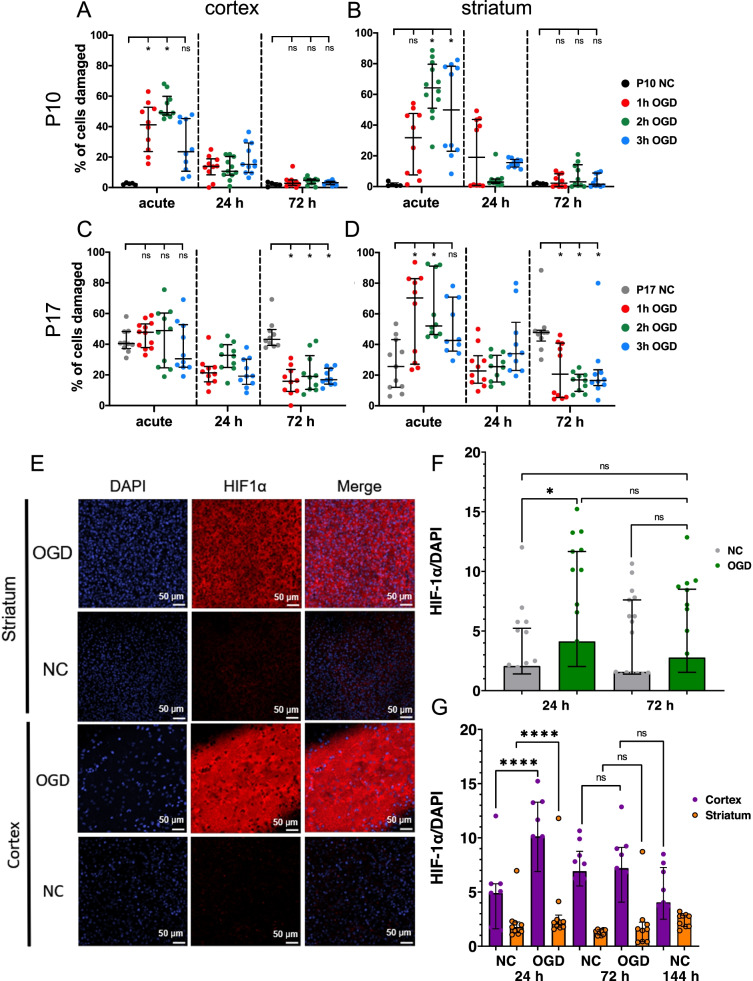
Fig. 6.
Profiles of % of cells damaged following 1 h, 2 h, or 3 h OGD quantified via PI staining, live-dead cell counting, and HIF1α intensity. Data from each age are contained in their own row. Each dot represents a single ROI, where n = 10–12 ROIs with 5–6 ROIs per slice. P10 (A) cortex and (B) striatum data are presented in the top row. P17 (C) cortex and (D) striatum data are given in the bottom row. Error bars represent the median ± IQR. E Representative images of HIF1α staining 24 h after 2 h OGD at 4DIV from P10 slices (scale bar = 50 μm). F Mean intensity of HIF1α staining 24 h and 72 h after 2 h OGD. Each point represents a single image. G Mean intensity of HIF1α staining 24 h and 72 h after 2 h OGD in the cortex and striatum. Error bars represent the median ± IQR for (E, F, G)

