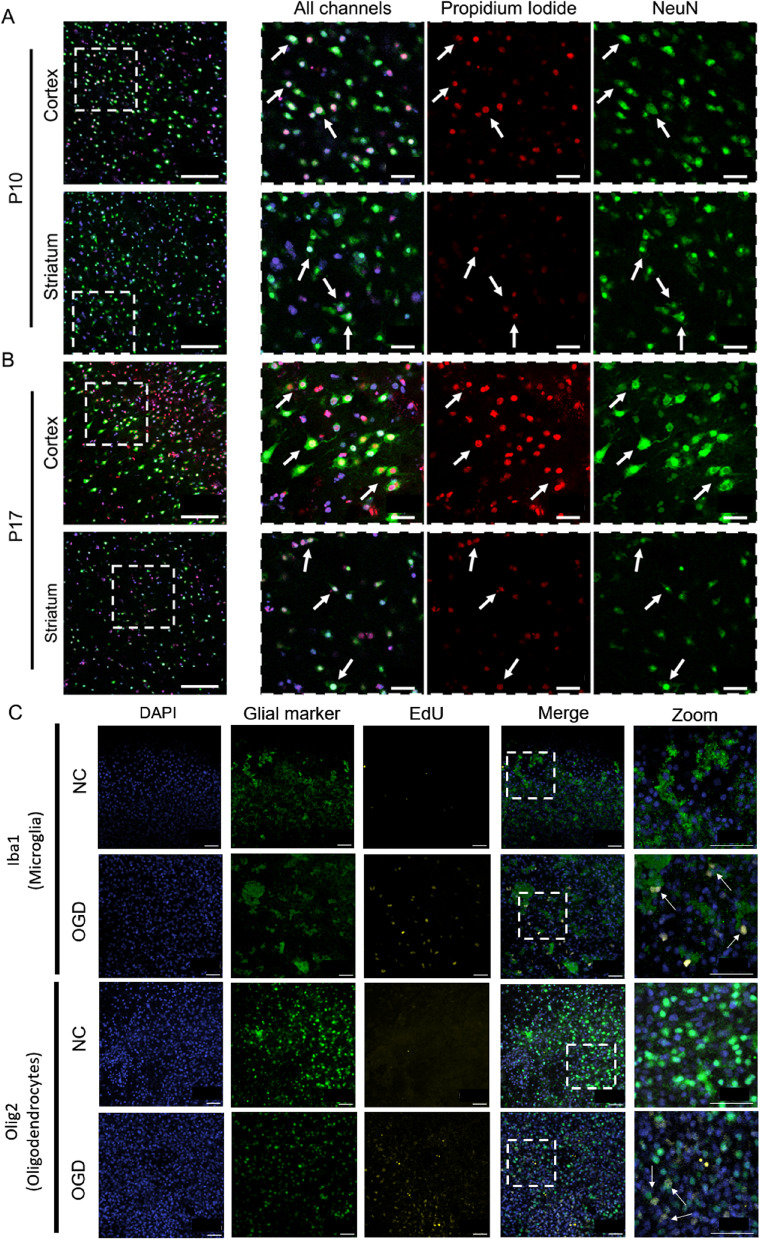
Fig. 7.
Cellular response immediately following 2 h OGD. Representative images are shown for (A) P10 and (B) P17 slices for PI (red) and NeuN (green) co-staining. The left column has a 40x magnification image; higher magnification images from the white dashed line box display a merged image, an image of PI alone, and an image of NeuN alone. Scale bars for the 40x magnification images: 100 μm. Scale bars for the zoomed in images: 25 μm. C Representative images of Iba + microglia (green) and Olig2+ oligodendrocytes (green) co-stained with EdU (yellow) marker for proliferation in the striatum 24 h after OGD or at equivalent culture time for NC. In all images, cell nuclei are stained with DAPI (blue). Scale bars = 50 μm

