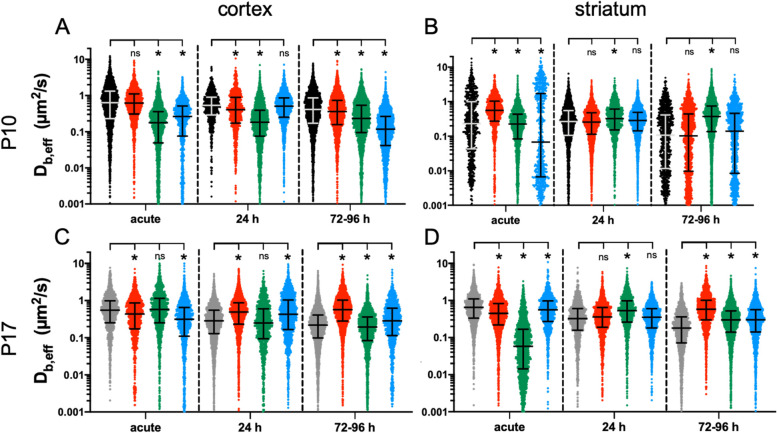
Fig. 8.
Db,eff distributions for 40 nm PS-PEG nanoparticles navigating the extracellular space of P10 and P17 brain slices following 1 h, 2 h, or 3 h OGD. Db,eff distributions were generated from MPT experiments performed at an acute, 24 h-, and 72-96 h post-OGD timepoint. Each row represents a brain age. The top row consists of data generated from the (A) cortex and (B) striatum of P10 OWH brain slices. The bottom row contains Db,eff distributions from the (C) cortex and (D) striatum of P17 OWH brain slices. In all instances, the red, green, and blue markers represent 1 h, 2 h, and 3 h OGD groups, respectively. Error bars represent the median Db,eff ± IQR

