
Figure 4. Immunofluorescent analysis of LC3B following VPS35 silencing.
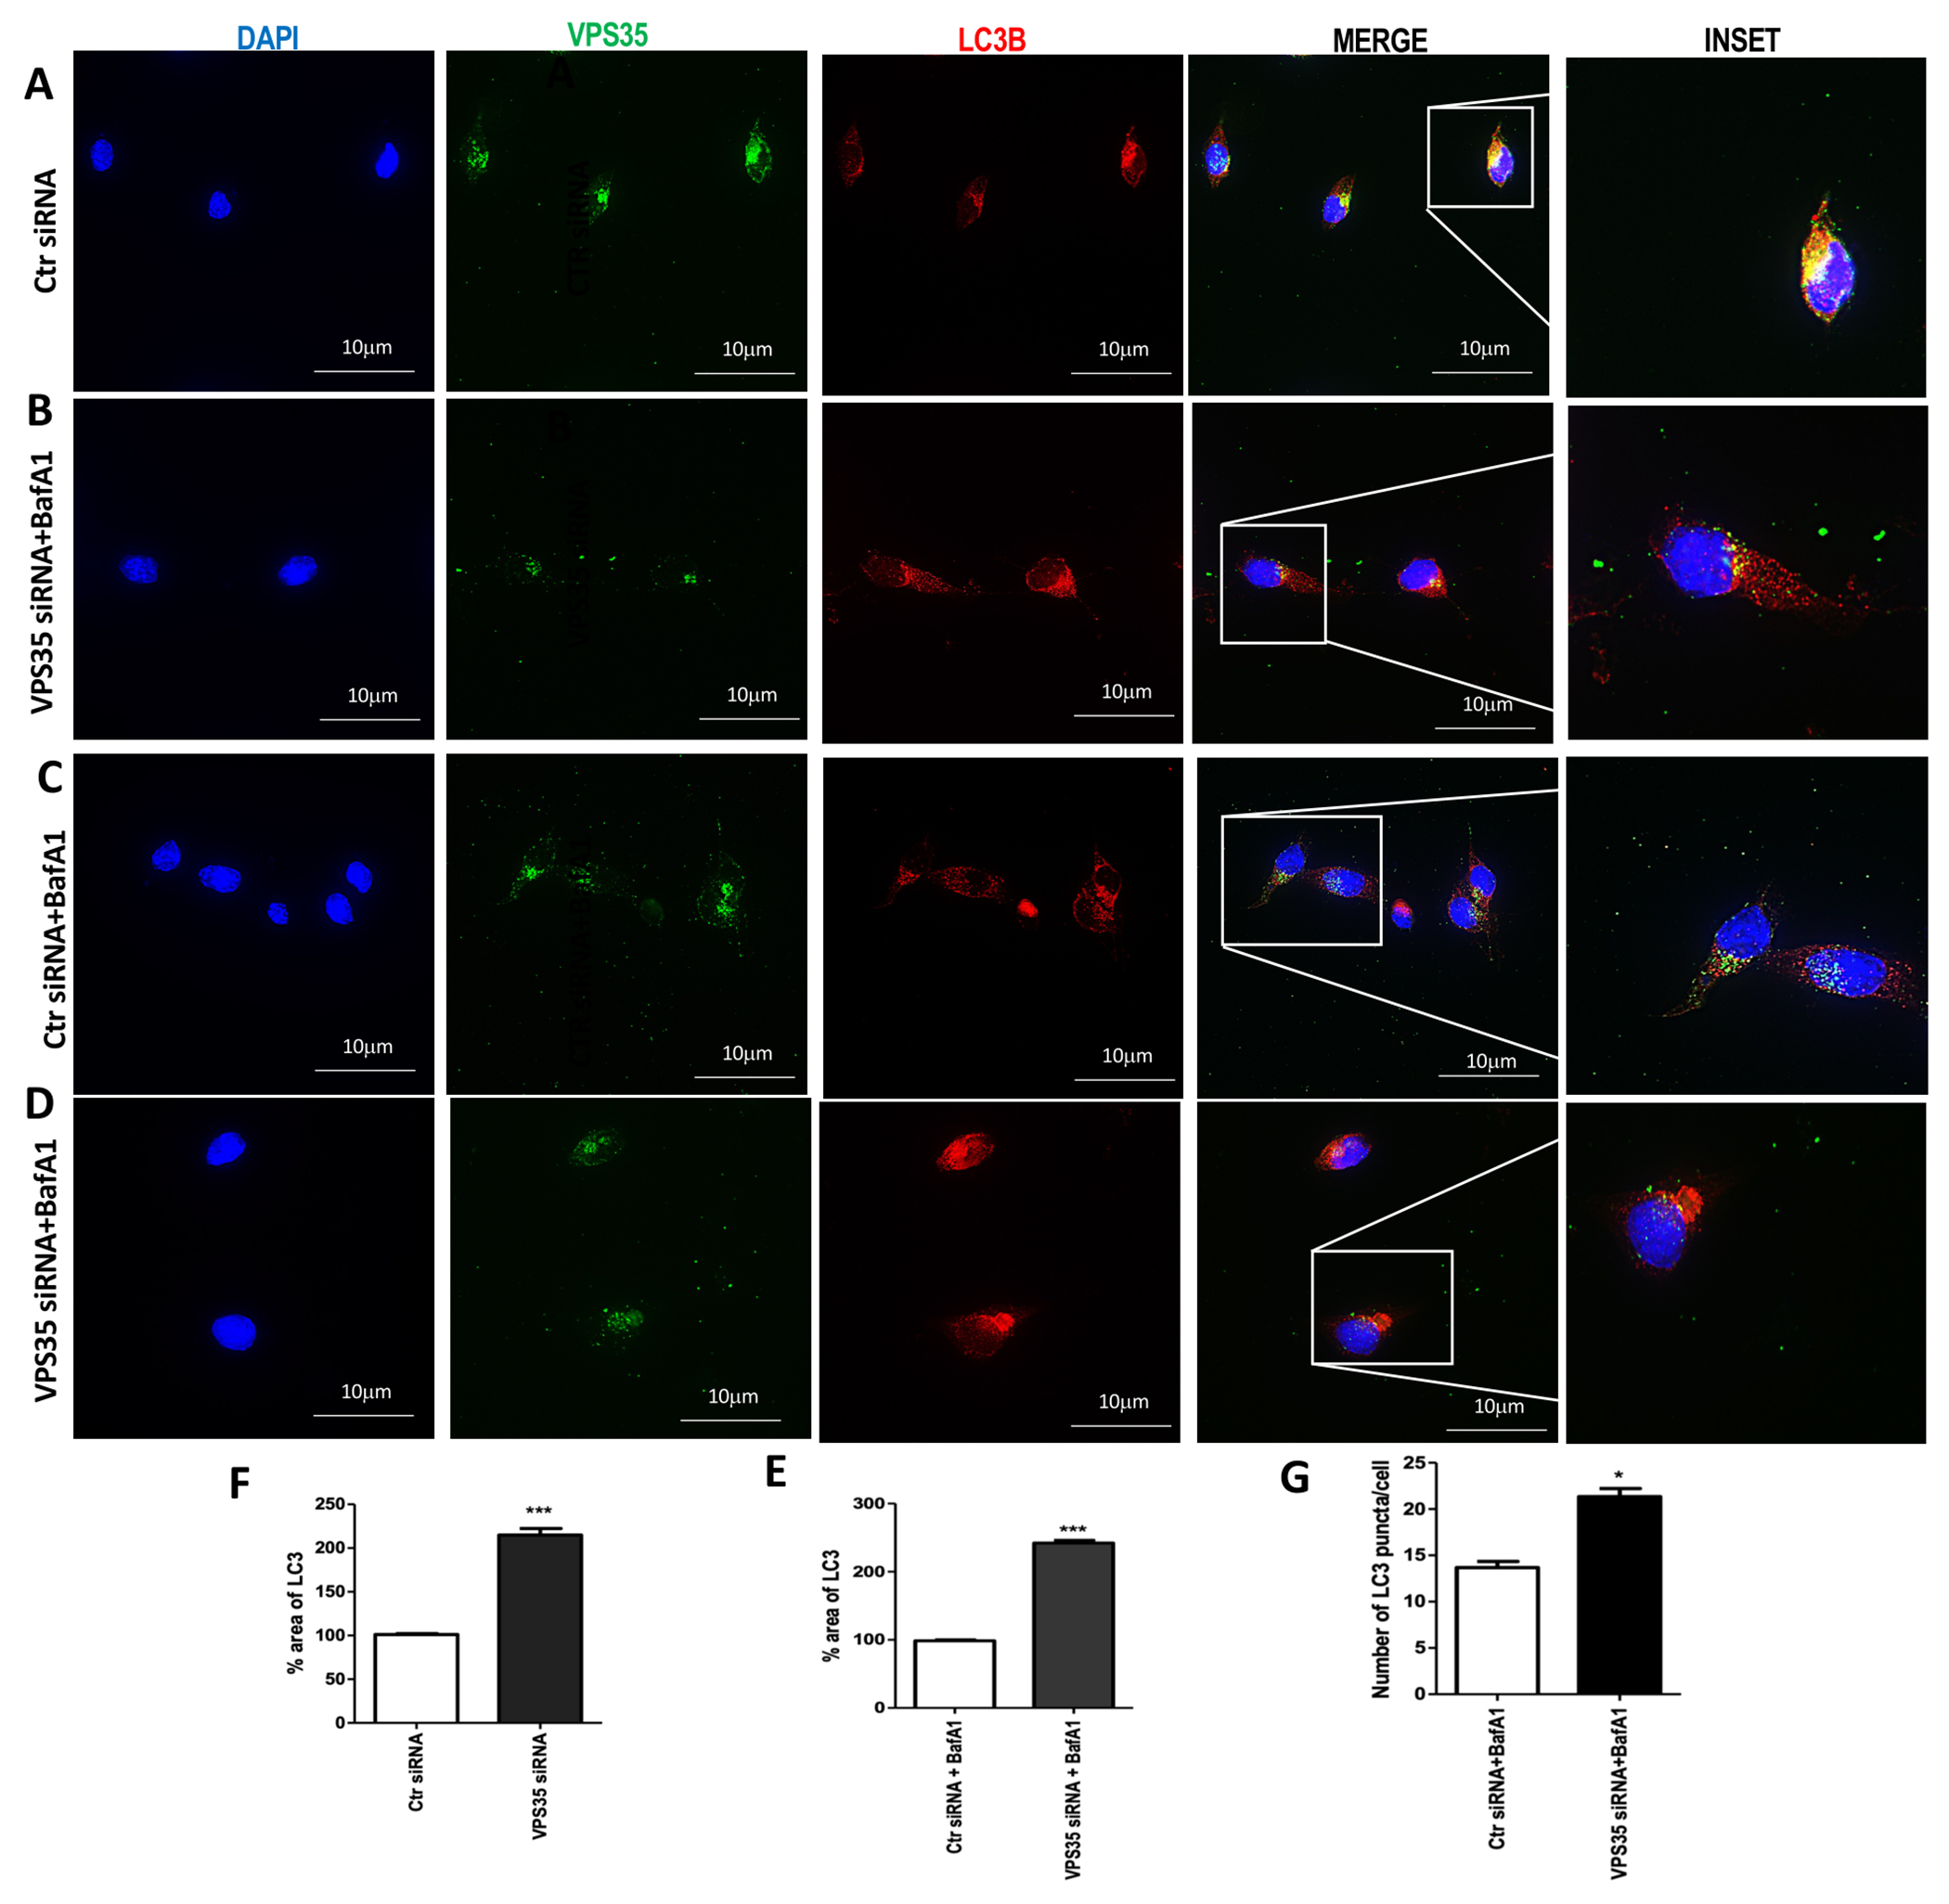
Representative images of control cells (A) and VPS35 silenced (B) for VPS35 (FITC channel, green), LC3B (TXred) and nuclear stain DAPI (blue) LC3B ICC of BafA1-treated control cells (C) and VPS35 silenced cells (D). Representative images showing the morphology of LC3B-positive structures (yellow arrows) in N2A-APPswe cells transfected with VPS35 siRNA or controls (Lipofectamine, scramble siRNA) (C and D) (Scale bar: 10 μm) Percentage area of LC3B (E and F) (*** p < 0.001 vs Ctr siRNA). Quantification of the LC3B puncta cells average number over total cell number (G) (* p < 0.05 vs Ctr siRNA). Data are from three individual experiments.