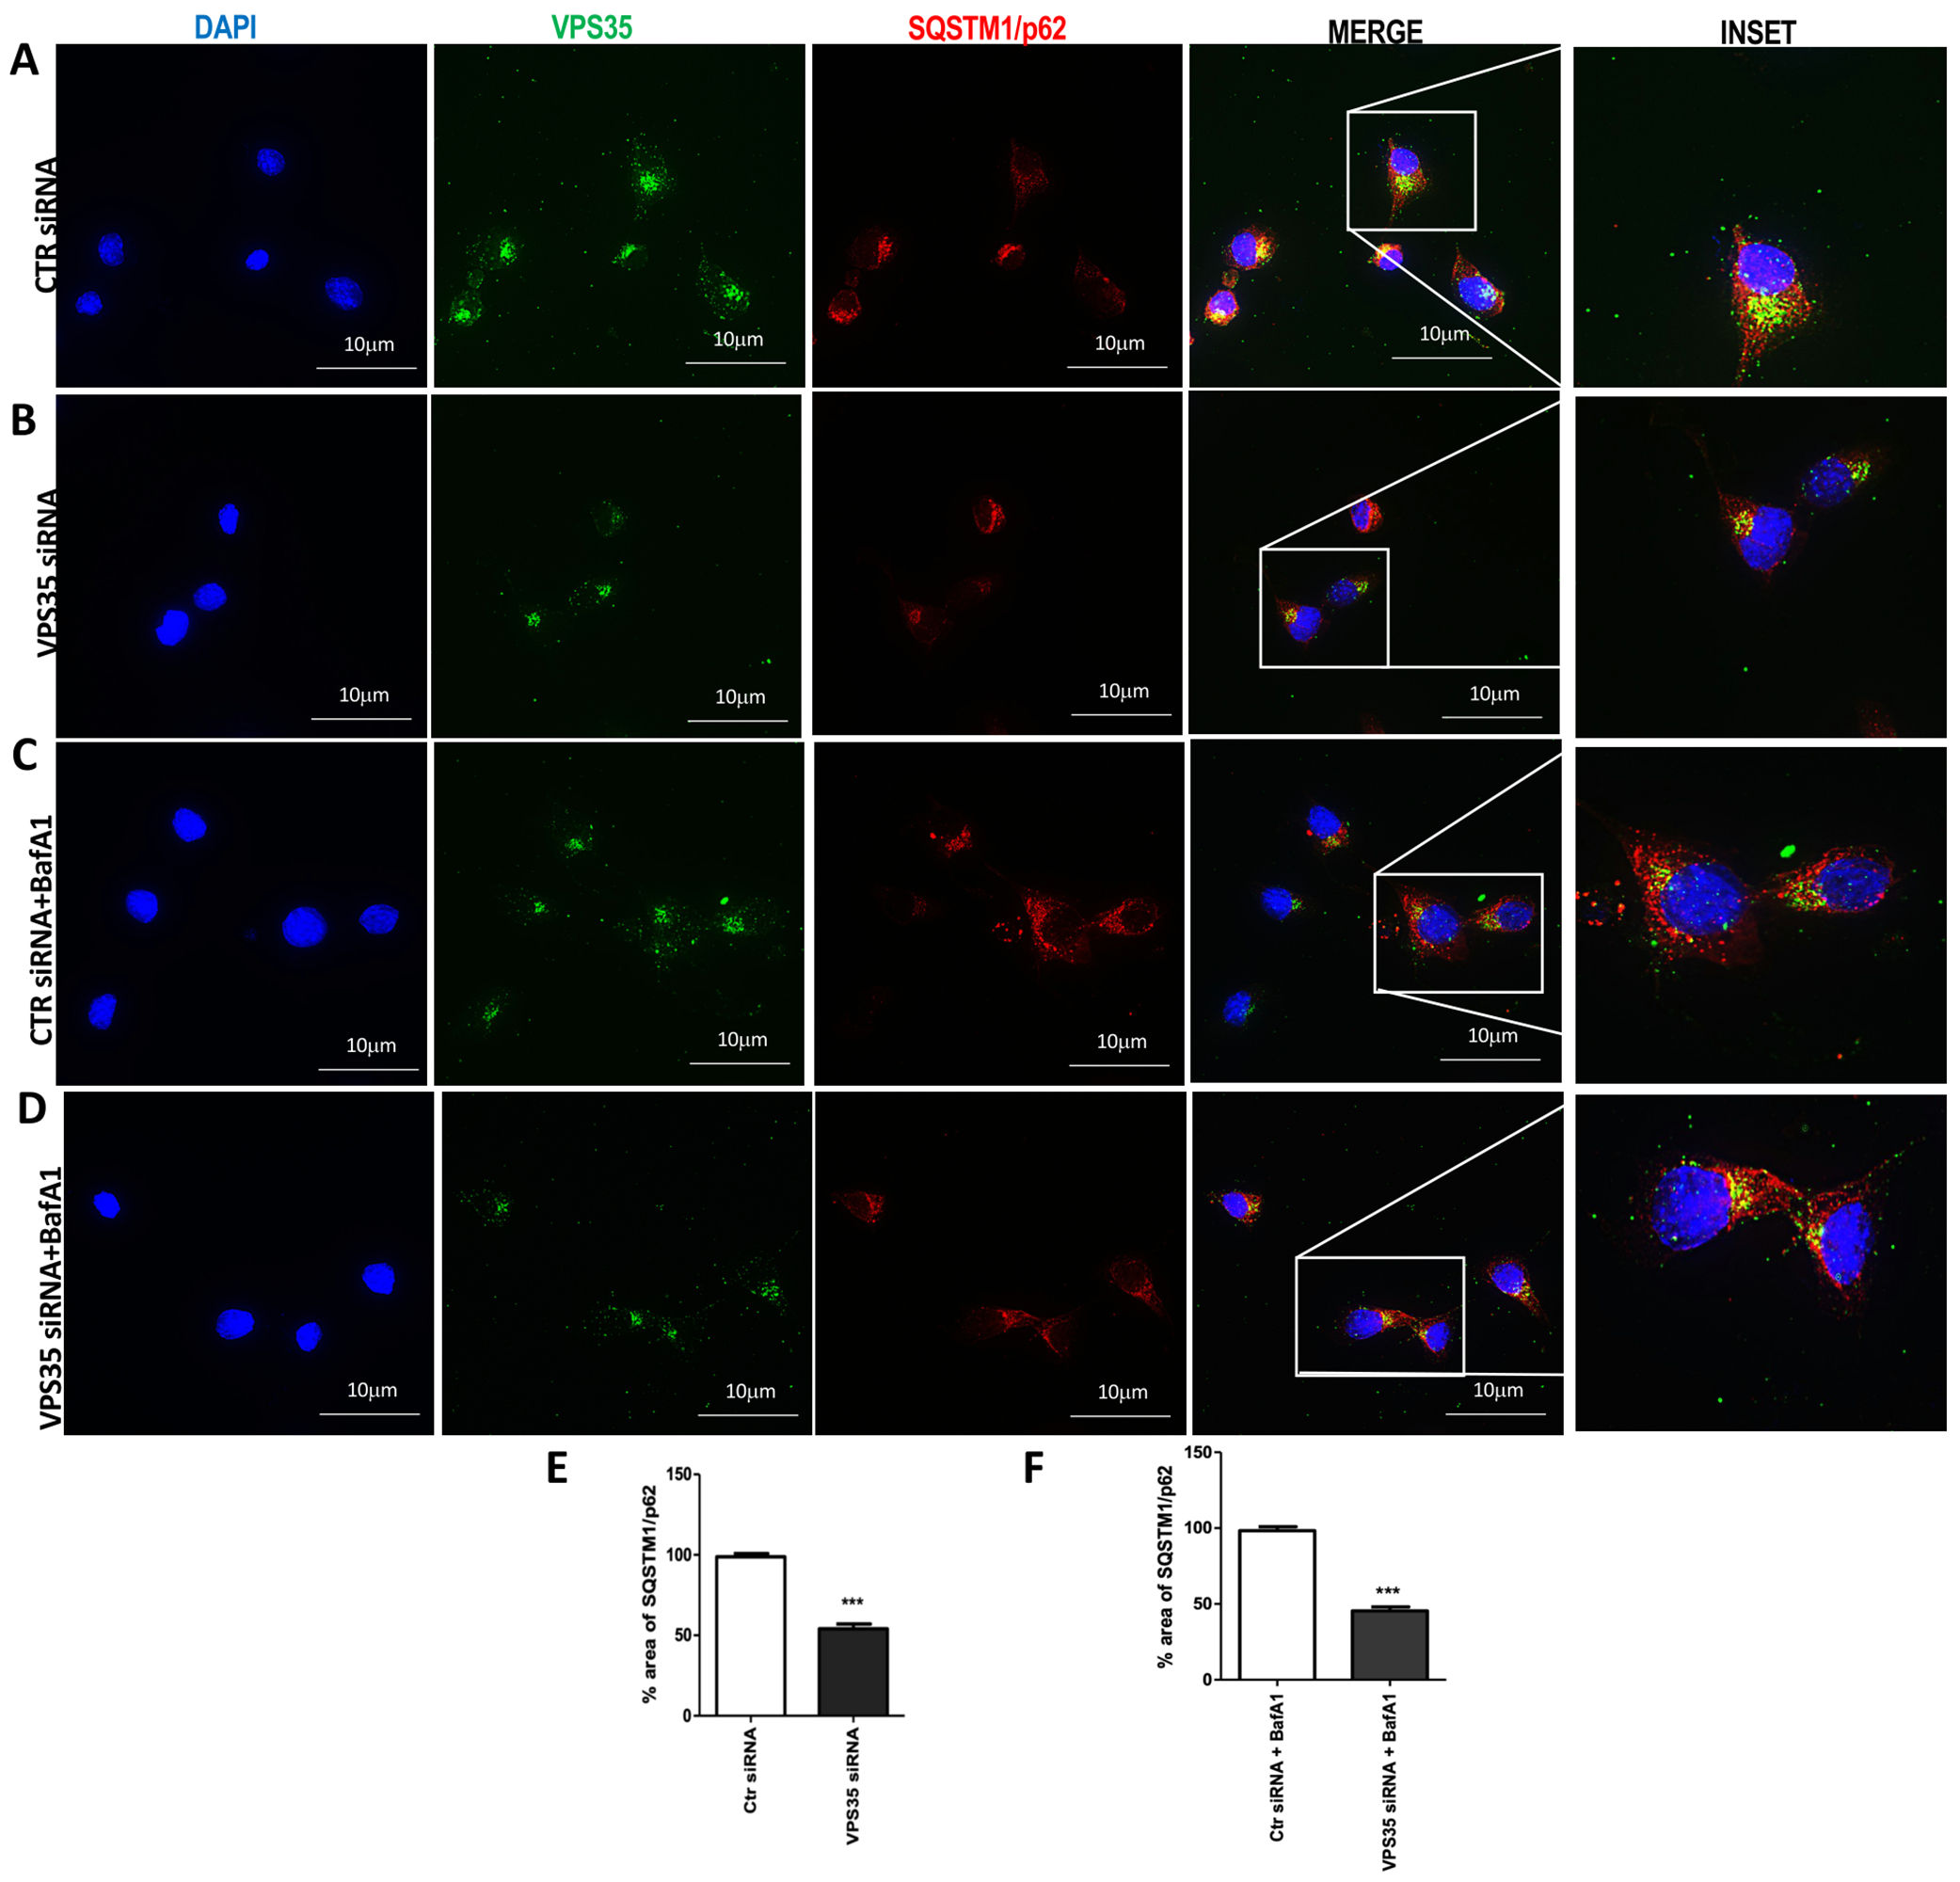
Figure 5. Immunofluorescence analysis of p62 following VPS35 silencing in N2A-APPswe cells.

Representative images of control cells (A) and VPS35 silenced (B) for VPS35 (FITC channel, green), LC3B (TXred) and nuclear stain DAPI (blue). p62 ICC analysis of BafA1-treated control cells (C) and VPS35 silenced cells (D) (Scale bar: 10 μm). Percentage area of p62 (E and F) (*** p < 0.001 vs Ctr siRNA). Data are from three individual experiments.
